.png)

Key Takeaways
- Reverse-engineer your PPC budget from the revenue target, never from last year's spend or industry medians.
- Use LTV:CAC and CAC payback as the two gates that decide whether to scale, hold, or pause spend.
- Start from a 60/25/15 split between high-intent search, ABM plus paid social, and a ring-fenced test budget. Flex the split by ACV and motion.
- Build a 15-20% CPC inflation buffer into every quarterly forecast for 2026, plus a 5% competitive-defense reserve.
- Set guardrails at the channel level (target CPL, ROAS floor, kill criteria), and review the dashboard weekly.
- Teams that beat plan run a daily ops audit, a weekly trend review, and a monthly realignment.
Why Most SaaS PPC Budgets Miss in 2026
Most SaaS PPC budgets miss because they are set as a percentage of ARR with last year's channel ratios, never as a chain of math that links a dollar of spend to a revenue outcome.
The auction has changed underneath those plans. Non-brand Google CPCs climbed 29% year over year while clicks on the same searches fell 26%, per the Dreamdata 2025 benchmark covering hundreds of B2B accounts from August 2024 to July 2025. Marketing budgets, meanwhile, flatlined at 7.7% of revenue, per the Gartner CMO Spend Survey.
Auction prices moved. Budgets did not. A plan signed in January runs 15% to 20% short by Q4, and across the SaaS paid audits we ran in the last 18 months only one in four budgets could survive the question every CFO eventually asks: how does this dollar turn into pipeline?
Agency Data Insight
Pulling the last 30 days of live spend from a representative slice of the active B2B SaaS Google Ads accounts we manage, blended non-brand search CPL ranged from $66 on PLG-motion accounts to $345 on enterprise-ABM accounts in the same month, a 5.2x spread on what an industry post would call "the average B2B SaaS CPL." Search CPC across the same slice averaged $6.25 with individual accounts running from $2.89 to $12.47. The variance is the point: a budget set against a benchmark CPL never matches what the auction will actually charge your specific ICP next quarter.
Two failure modes show up in almost every audit:
- Top-down budget. The CFO picks a percentage of ARR, the CMO splits it by last year's ratios, and the paid team is asked to make the number work. When the quarter misses, the team cannot tell whether the plan was wrong or the execution was.
- Bottom-up wishlist. The paid team submits what every channel could absorb in theory. Cuts get made by feel. What survives is whichever channel had the loudest advocate, never the one that produces the highest-margin pipeline.
Both shapes share the same structural flaw. Neither links a dollar of spend to a revenue outcome through math the CFO can audit. In an auction environment with 29% CPC inflation and flat budgets, that shortfall compounds fast.
The framework below is the five-step walk we run with every CMO and CFO in week one of a new engagement. The goal is a single chain of math, owned end-to-end, that the CFO can defend in front of the board and the paid team can operationalise on Monday.
To keep the math concrete, we will thread one working example through all five steps: a $5M ARR B2B SaaS with a $25K ACV, targeting $5M of net new ARR next year. Your numbers will look different. The shape of the walk stays the same, and by Step 5 you will have seen exactly how one number becomes a weekly operating system.
Step 1: Reverse-Engineer the Budget From Revenue
Start with the ARR target and walk the funnel backwards. The formula is five lines:
Pipeline target = Net new ARR target × 3x to 4x coverage
Opportunities = Pipeline target ÷ ACV
SQLs = Opportunities ÷ (SQL → Opp rate)
MQLs = SQLs ÷ (MQL → SQL rate)
PPC budget = MQLs × Blended CPL
An illustrative example:
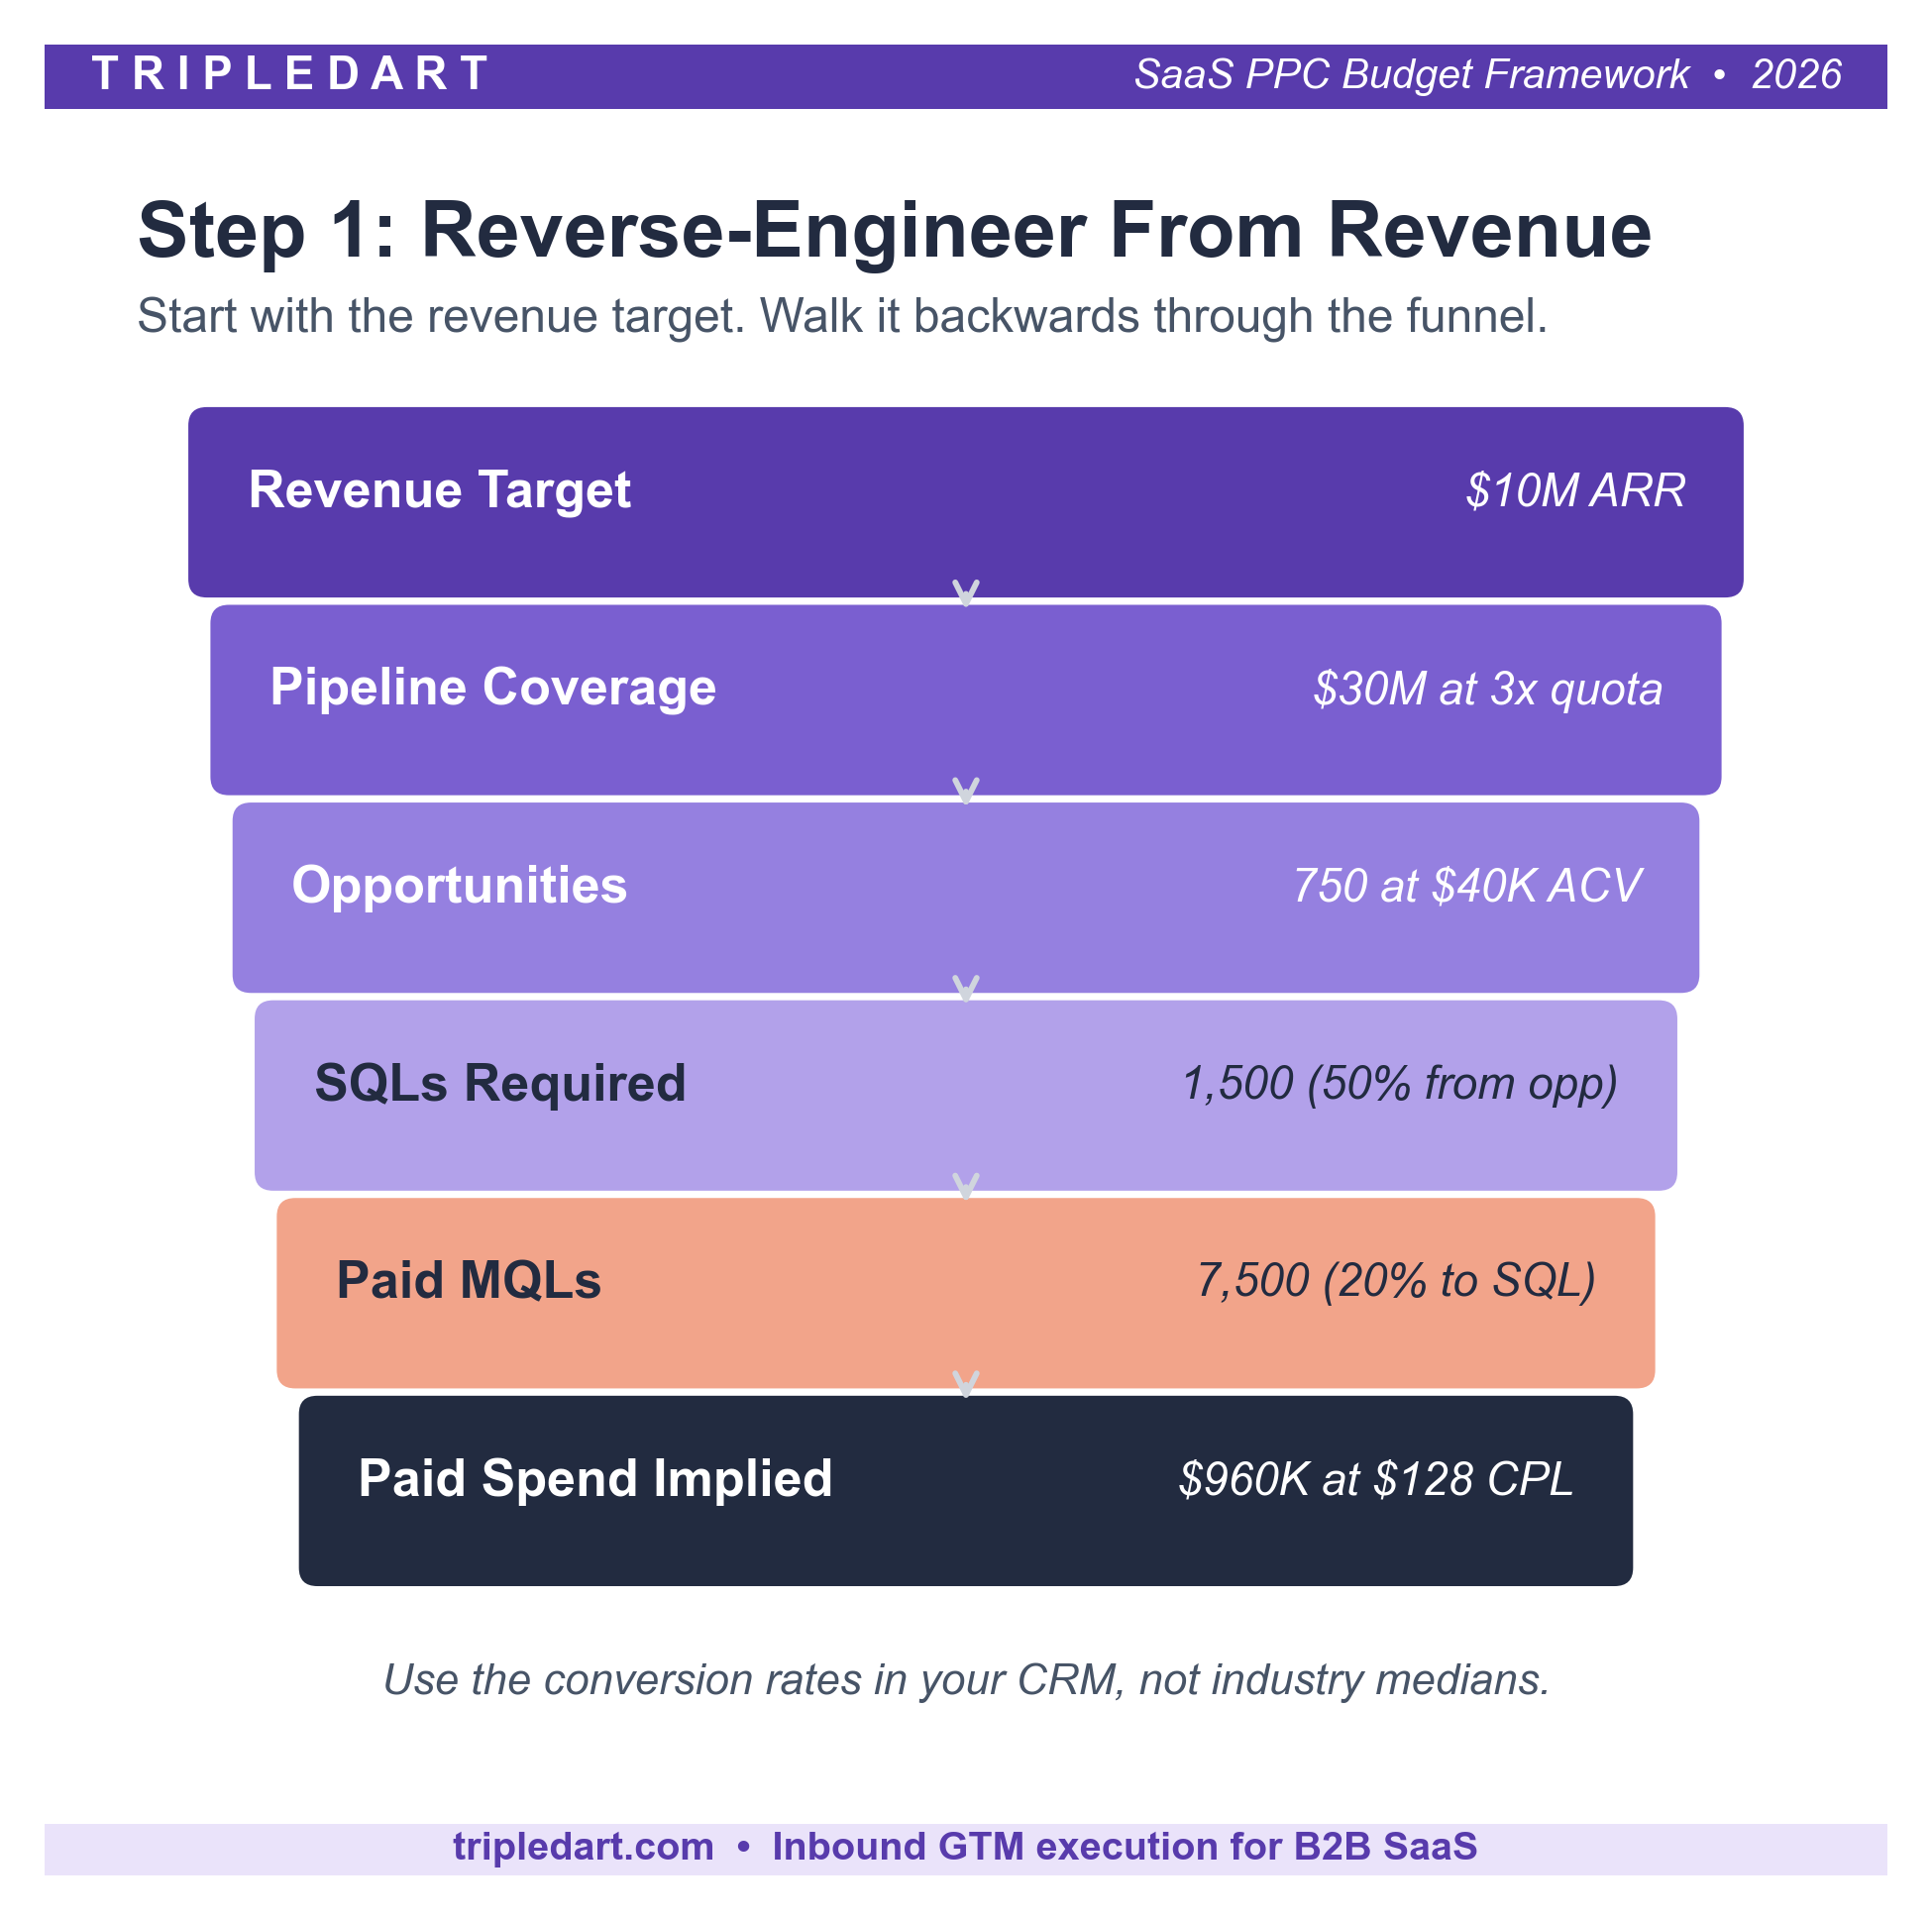
Plug the anchor company into the formula. $5M of net new ARR, 3x pipeline coverage, $25K ACV, and realistic B2B conversion rates pulled from a typical CRM:
Pipeline target = $5M × 3x coverage = $15M
Opportunities = $15M ÷ $25K ACV = 600
SQLs = 600 ÷ 55% SQL→Opp = 1,091
MQLs = 1,091 ÷ 18% MQL→SQL = 6,062
PPC budget = 6,062 × $150 blended CPL = $910K / year ≈ $75K / month
That $75K a month is the number your CFO can audit. Every figure sits on a conversion rate or a price you can point to. Change one input and the downstream math moves with it. The hour your CMO and CFO spend together calibrating those rates is, in our experience, the highest-yield hour of the entire planning cycle.
Why Your CRM Rates Beat Industry Benchmarks
Industry benchmarks are calibration tools, never planning inputs. In the last 18 months of paid audits we ran for Series B SaaS clients, the average gap between the conversion rates assumed in the plan and the rates sitting in the CRM was 31%, with individual funnel stages drifting 50% in either direction.
A team that thinks MQL-to-SQL runs at 20% because they saw it in a benchmark post, when the CRM shows 12%, has just set a budget 67% too low for the pipeline target.
A team that assumes 35% when the real number is 45% buys leads that were never needed.
Both sit on the wrong denominator, and both discover the error only after the quarter closes.
If you have no cohort data yet, the ranges below are safe sanity checks while you build your own:
When the Total Exceeds What Finance Will Sign
When the honest math produces a total the business cannot afford, three levers can pull the number down without breaking the plan:
- Improve conversion rates upstream of paid through tighter ICP definition, landing page CRO, and lead scoring.
- Raise ACV so each opportunity carries more weight against the same pipeline target.
- Negotiate a lower revenue target with the CEO before the quarter starts, never after it ends.
Pretending the math will stretch is how SaaS teams end up explaining a 22% miss to the board and pitching next year as "ambitious."
Case Study: Apty
Apty, a digital adoption platform serving enterprise accounts, needed to tie their paid budget to pipeline outcomes across both PPC and paid social. After reverse-engineering the budget from revenue and tightening their keyword strategy, Apty posted a 164% increase in deal pipeline from paid search, a 124% lift in impression share, and a 50% improvement in CTR. Read the full Apty case study.
You have a number. A good one, tied to revenue. But a number alone does not prove the business can afford to spend it. A team can generate $75K a month from any set of inputs. The gate in Step 2 separates a defensible plan from a wishful one.
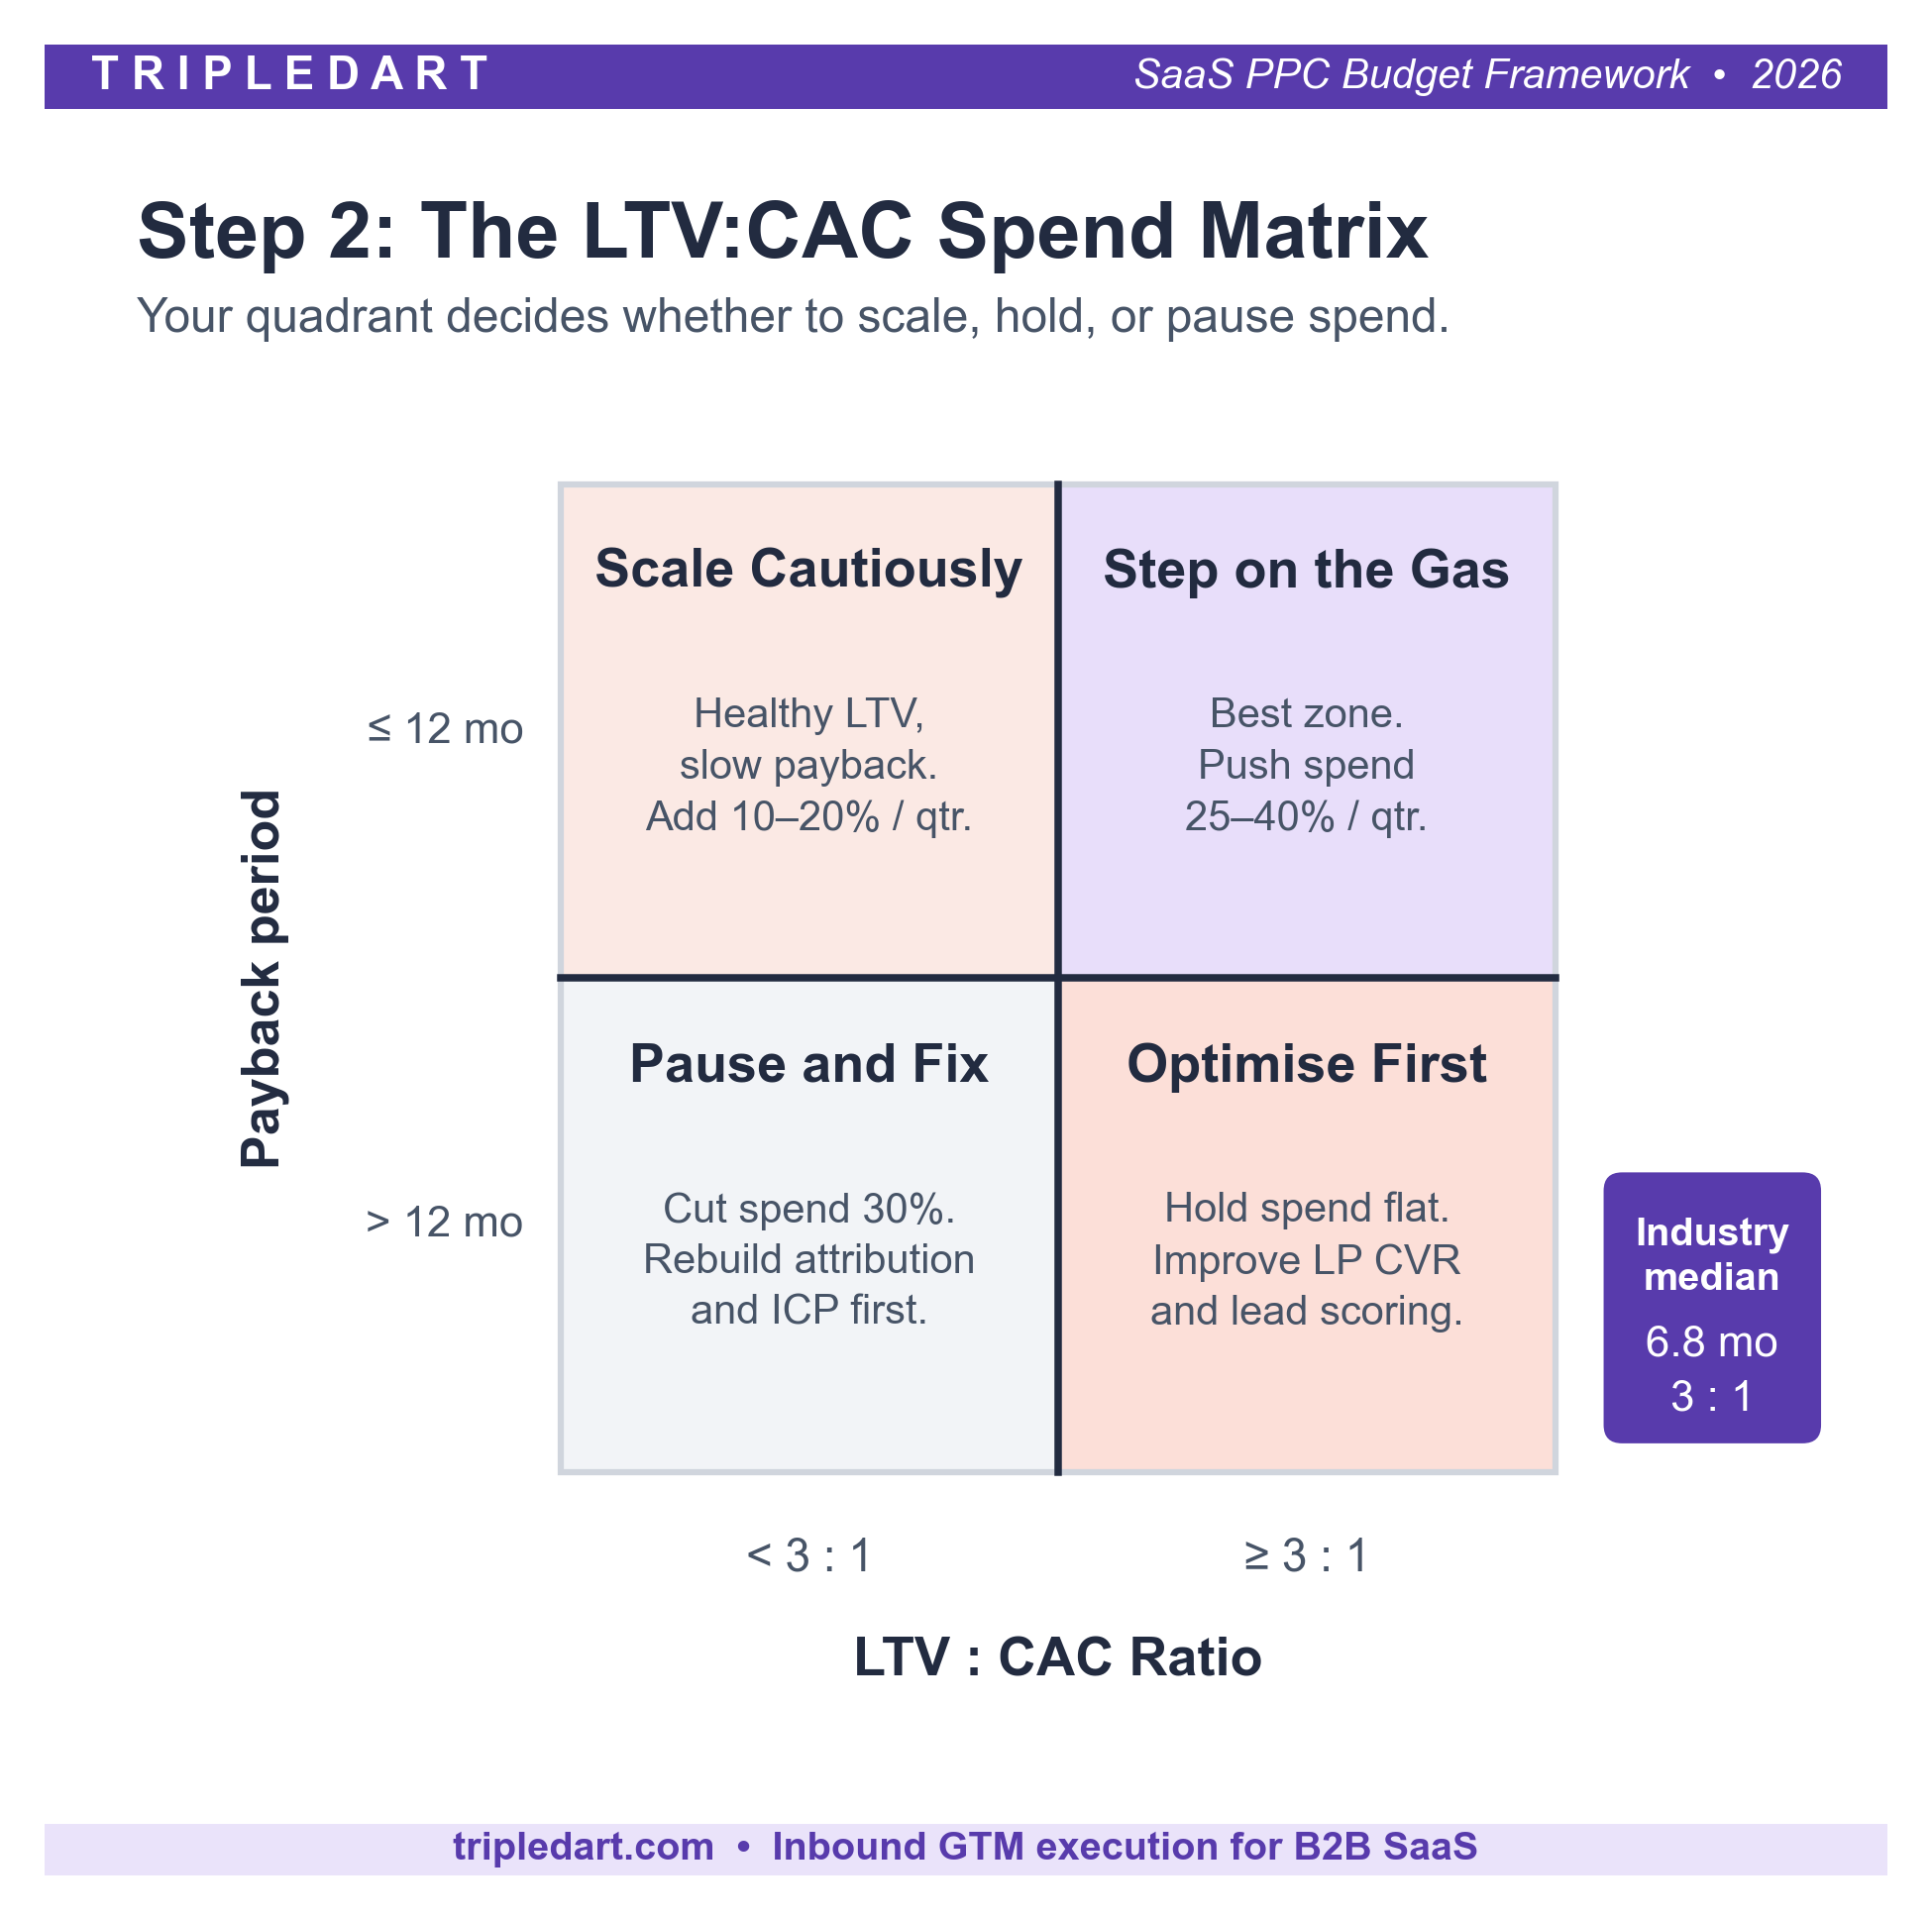
Step 2: Gate the Total on LTV:CAC and Payback
You are staring at $75K a month on paper. The question the gate answers is whether every customer that $75K buys is worth more than what it cost to buy them. Approve the Step 1 total only when your LTV:CAC ratio is at least 3:1 and your CAC payback period is under 12 months. Two ratios do most of the work.
What Is a Good LTV:CAC Ratio for B2B SaaS?
The accepted floor for B2B SaaS is 3:1, the ratio between customer lifetime value and fully-loaded customer acquisition cost. HubSpot walks through the math cleanly in their LTV:CAC explainer. Scale-stage SaaS above $10M ARR commonly runs 3.8:1 to 5:1, and adtech-flavored businesses occasionally reach 7:1.
Below 3:1, every additional dollar of paid spend widens the hole that retention has to climb out of. The burn-rate cliff usually arrives faster than the team expects.
Healthy CAC Payback Periods for SaaS
A healthy CAC payback period for SaaS sits under 12 months, with the median across more than 14,000 tracked SaaS companies at 6.8 months. Above 18 months and your finance team will (rightly) start asking working-capital questions the marketing team is not equipped to answer.
Agency Data Insight
Across the 250+ B2B tech engagements we have run, paid-attributable CAC (the cost of acquiring customers who first touched through a paid channel) sits at 1.4x to 1.8x the blended CAC figure, yet fewer than 20% of SaaS CFOs track the two numbers separately in the board deck. When a finance team benchmarks paid against blended CAC, the budget conversation usually ends with one side feeling ambushed. Pulling paid-attributable CAC onto its own line in the plan typically unlocks a 10-15% upside in approved paid budget inside the first quarter of partnership.
Track Paid-Attributable CAC Separately
Paid-attributable CAC isolates the cost of acquiring customers who first touched through a paid channel, separate from organic, referral, and outbound CAC. Tracking it on its own line shows the true marginal cost of each incremental paid-sourced customer and prevents the blended average (which includes free leads) from masking an expensive paid motion.
Run the anchor company through the gate.
Assume $95K LTV (a $25K ACV stretched over 3.8 average years of retention) and fully-loaded paid CAC of $28K. That gives LTV:CAC of 3.4:1 and a payback of 11 months. Both pass. The $75K clears.
If your gate says no, the correct response is to tighten the funnel, raise pricing, or renegotiate the revenue target with the CEO before the quarter starts. Inflating the unit economics inside the model is how companies quietly deplete cash while the dashboard looks green.
The gate says yes. Now the $75K has to go somewhere. A $75K bucket dropped into the wrong channels burns as fast as a $75K plan that never got approved. Step 3 decides where each dollar earns its place.
Step 3: The 60/25/15 Channel Split
You have an approved $75K. Here is where it goes.
Split the total 60% to highest-intent search (brand plus non-brand bottom-funnel, Capterra, G2 paid, Gartner Digital Markets), 25% to ABM and paid social (LinkedIn ABM and Meta retargeting against named accounts), and 15% to a ring-fenced test budget for new channels, creative formats, and audiences.
Flex the split based on ACV, sales motion, and vertical.
Why the 60/25/15 Split Works for B2B SaaS
The 60/25/15 split matches budget to intent. The 60% highest-intent search bucket captures buyers who have already declared purchase intent by typing a query. The 25% ABM and paid social bucket gives up search's intent in exchange for targeting precision against named accounts. The 15% test budget preserves option value for the channels a Series B SaaS team will need next year but has not built yet.
Search at 60% delivers the most predictable CAC of any paid channel because the buyer typed the query. Our Google Ads guide for SaaS covers the structural choices that move the math at this layer.
ABM and paid social at 25% trades intent for targeting precision, used as the pipeline-acceleration layer that warms named accounts, multi-threads opportunities, and reactivates quiet ICP segments. LinkedIn ad costs stayed punishing through 2026, but a tight ABM motion still beats blended demand-gen by 2x to 4x on pipeline efficiency.
Test budget at 15% funds the next channel, the next creative angle, and the next audience experiment. Teams that skip this bucket end up locked into the mix that worked two years ago.
For the anchor company, the $75K splits cleanly:
- $45K to high-intent search (Google Search, Capterra, G2, Gartner Digital Markets)
- $18.75K to ABM and paid social (LinkedIn ABM plus Meta retargeting against named accounts)
- $11.25K to test budget (the next channel you will wish you had built a quarter from now)
Three real dollar amounts your paid team can take to campaigns on Monday.
Agency Data Insight
Looking at the live cross-channel data inside the SaaS portfolios we run, last 30 days of activity shows blended Google Search CPC at $6.25 against Meta CPC at $2.67, a clean 2.3x gap that tempts every CFO to push more budget into Meta. The CPL view flips half the conclusion: blended Search CPL lands near $139 while Meta CPL lands near $53, but the Meta leads convert to opportunity at roughly one-third the rate of search, which is why the 60/25/15 weights highest-intent search at the top. The cheapest-CPL channel is rarely the cheapest pipeline channel, and the dashboards that confuse those two numbers are the ones that misallocate the budget.
When to Flex the 60/25/15 Split
Flex the split when ACV, sales motion, or vertical changes the economics:
- ACV above $50K → push ABM to 35% and trim search to 50%. Named-account plays scale better than broad search at high ACV.
- PLG motion → push test budget to 25% and lean on search retargeting plus paid social activations.
- Cybersecurity, fintech, or healthcare (vertical CPCs hit $16 to $18) → shrink test to 10% because every dollar in search costs more.
A pattern repeats across the SaaS portfolios we manage. Teams that beat their pipeline plan protect the test budget through every quarter, including the painful ones. Teams that miss cut the test budget first when things tighten, which is the exact bucket that would have built the next quarter's growth. Panic almost always attacks the future.
The $45K / $18.75K / $11.25K split is a plan your paid team could launch this month. The trap is that the 2026 auction moves faster than your plan. If you hand this split to the team in January, the numbers that made it work in Q1 will be 15% to 20% off by Q4. Step 4 is how you protect the plan from its own calendar.
Step 4: Build CPC Inflation and Defense Buffers
You now have a plan your CFO approved and a split your paid team can execute. The next failure mode is the quietest one: the plan ages out.
Buffer a 15-20% CPC inflation line item on top of your Step 1 total, fence brand search spend away from non-brand growth spend in your reporting, and hold back 5% of the annual paid budget as a competitive-defense reserve you can deploy within 48 hours. In the 2026 auction, those three buffers decide whether your plan holds to Q4 or dies in September.
Across SaaS verticals, three compounding forces are reshaping auction economics:
- Non-brand CPCs are running 10% to 25% above 2024 levels in our live portfolio. Pulling the last 30 days from a representative slice of B2B SaaS accounts we manage, blended non-brand search CPC sits at $6.25, with vertical-specific accounts (cybersecurity-adjacent, AI-tooling) running into the $10 to $18 CPC band. That bracket sits 25% to 39% above the same accounts' 2024 baseline.
- Branded search CPCs have crept up roughly 18% year over year in our portfolio, driven by competitor bid pressure on incumbent brand terms and softer auction logic on brand queries.
- Performance Max blurs the line between channels, which forces conservative attribution decisions on tight quarters. In the same 30 day window across our portfolio, PMax CPC sits anywhere from $0.04 to $5.29 depending on shopping feed quality and ICP fit, which is exactly the kind of variance that masks itself inside a single weekly average.
A forecast that assumes flat CPCs runs 15% to 20% short by Q4. The plan signed in January dies quietly in September, and most SaaS teams only notice in October when the budget to fix it is already spent.
Agency Data Insight
The single most common wasted-spend pattern sits in the brand-versus-non-brand reporting split. In roughly 60% of new-client audits we run, 30% to 45% of what the team calls "search budget" is running on branded queries converting at 8% to 15%, while non-brand (the real acquisition engine) runs underfunded. Fencing brand and non-brand into separate campaigns and separate reporting lines typically recovers 12% to 18% of effective growth budget without a single extra dollar of approved spend.
Building the CPC Inflation Buffer as a Line Item
Build the CPC inflation buffer as a visible line item by taking your current blended CPC, adding 15%, re-running the Step 1 math against the inflated number, and recording the delta as a discrete row in the budget plan. A vague reserve disappears the first time someone needs to move money. A named line item survives.
Fencing Brand Search From Non-Brand
Brand search is revenue-defense spend, not growth spend. Brand queries convert at 8% to 15% at the cheapest CPCs in the portfolio, so combining the two buckets makes the blended number look healthier than reality while non-brand (the actual acquisition engine) starves. Our paid ads spend management playbook goes deep on the separation and the dashboard that enforces it.
Holding a Competitive Defense Reserve
A competitive defense reserve is a ring-fenced 5% of the annual paid budget kept unspent until a competitive event forces a rapid auction response: a new category entrant, an aggressive bid on incumbent brand terms, or a share-of-voice attack. AI-native competitors are entering established SaaS categories every month, and holding this reserve means the marketing team can defend share of voice on top category queries within 48 hours instead of writing a Q1 budget-reforecast memo in October.
For the anchor company, the three buffers land as follows:
- $13.5K per month CPC inflation buffer (18% on top of the $75K Step 1 total)
- ~$45.5K annual competitive-defense reserve (5% of the $910K annual budget, unspent until needed)
- Brand search fenced out of the $45K non-brand search bucket into its own reporting line
The board number climbs from $75K to $88.5K per month, with $45.5K held back. The CFO now knows exactly where every extra dollar goes and why. A question like "what are we buying with the extra $13.5K?" has an answer on one line.
The plan is sized, approved, split, and hardened. Nothing happens until someone runs it.
Step 5: Run the Budget as a Weekly System
A plan in a spreadsheet is a forecast. A plan on a dashboard with guardrails is a system. Turn the PPC budget into a weekly operating system by replacing the monthly cap with per-channel guardrails (a target CPL, a ROAS floor, and a kill criterion for every channel), and running three cadences on top: a daily ops audit, a weekly trend review with the CMO, and a monthly budget realignment. This is the layer that separates teams who beat plan from teams who explain the miss.
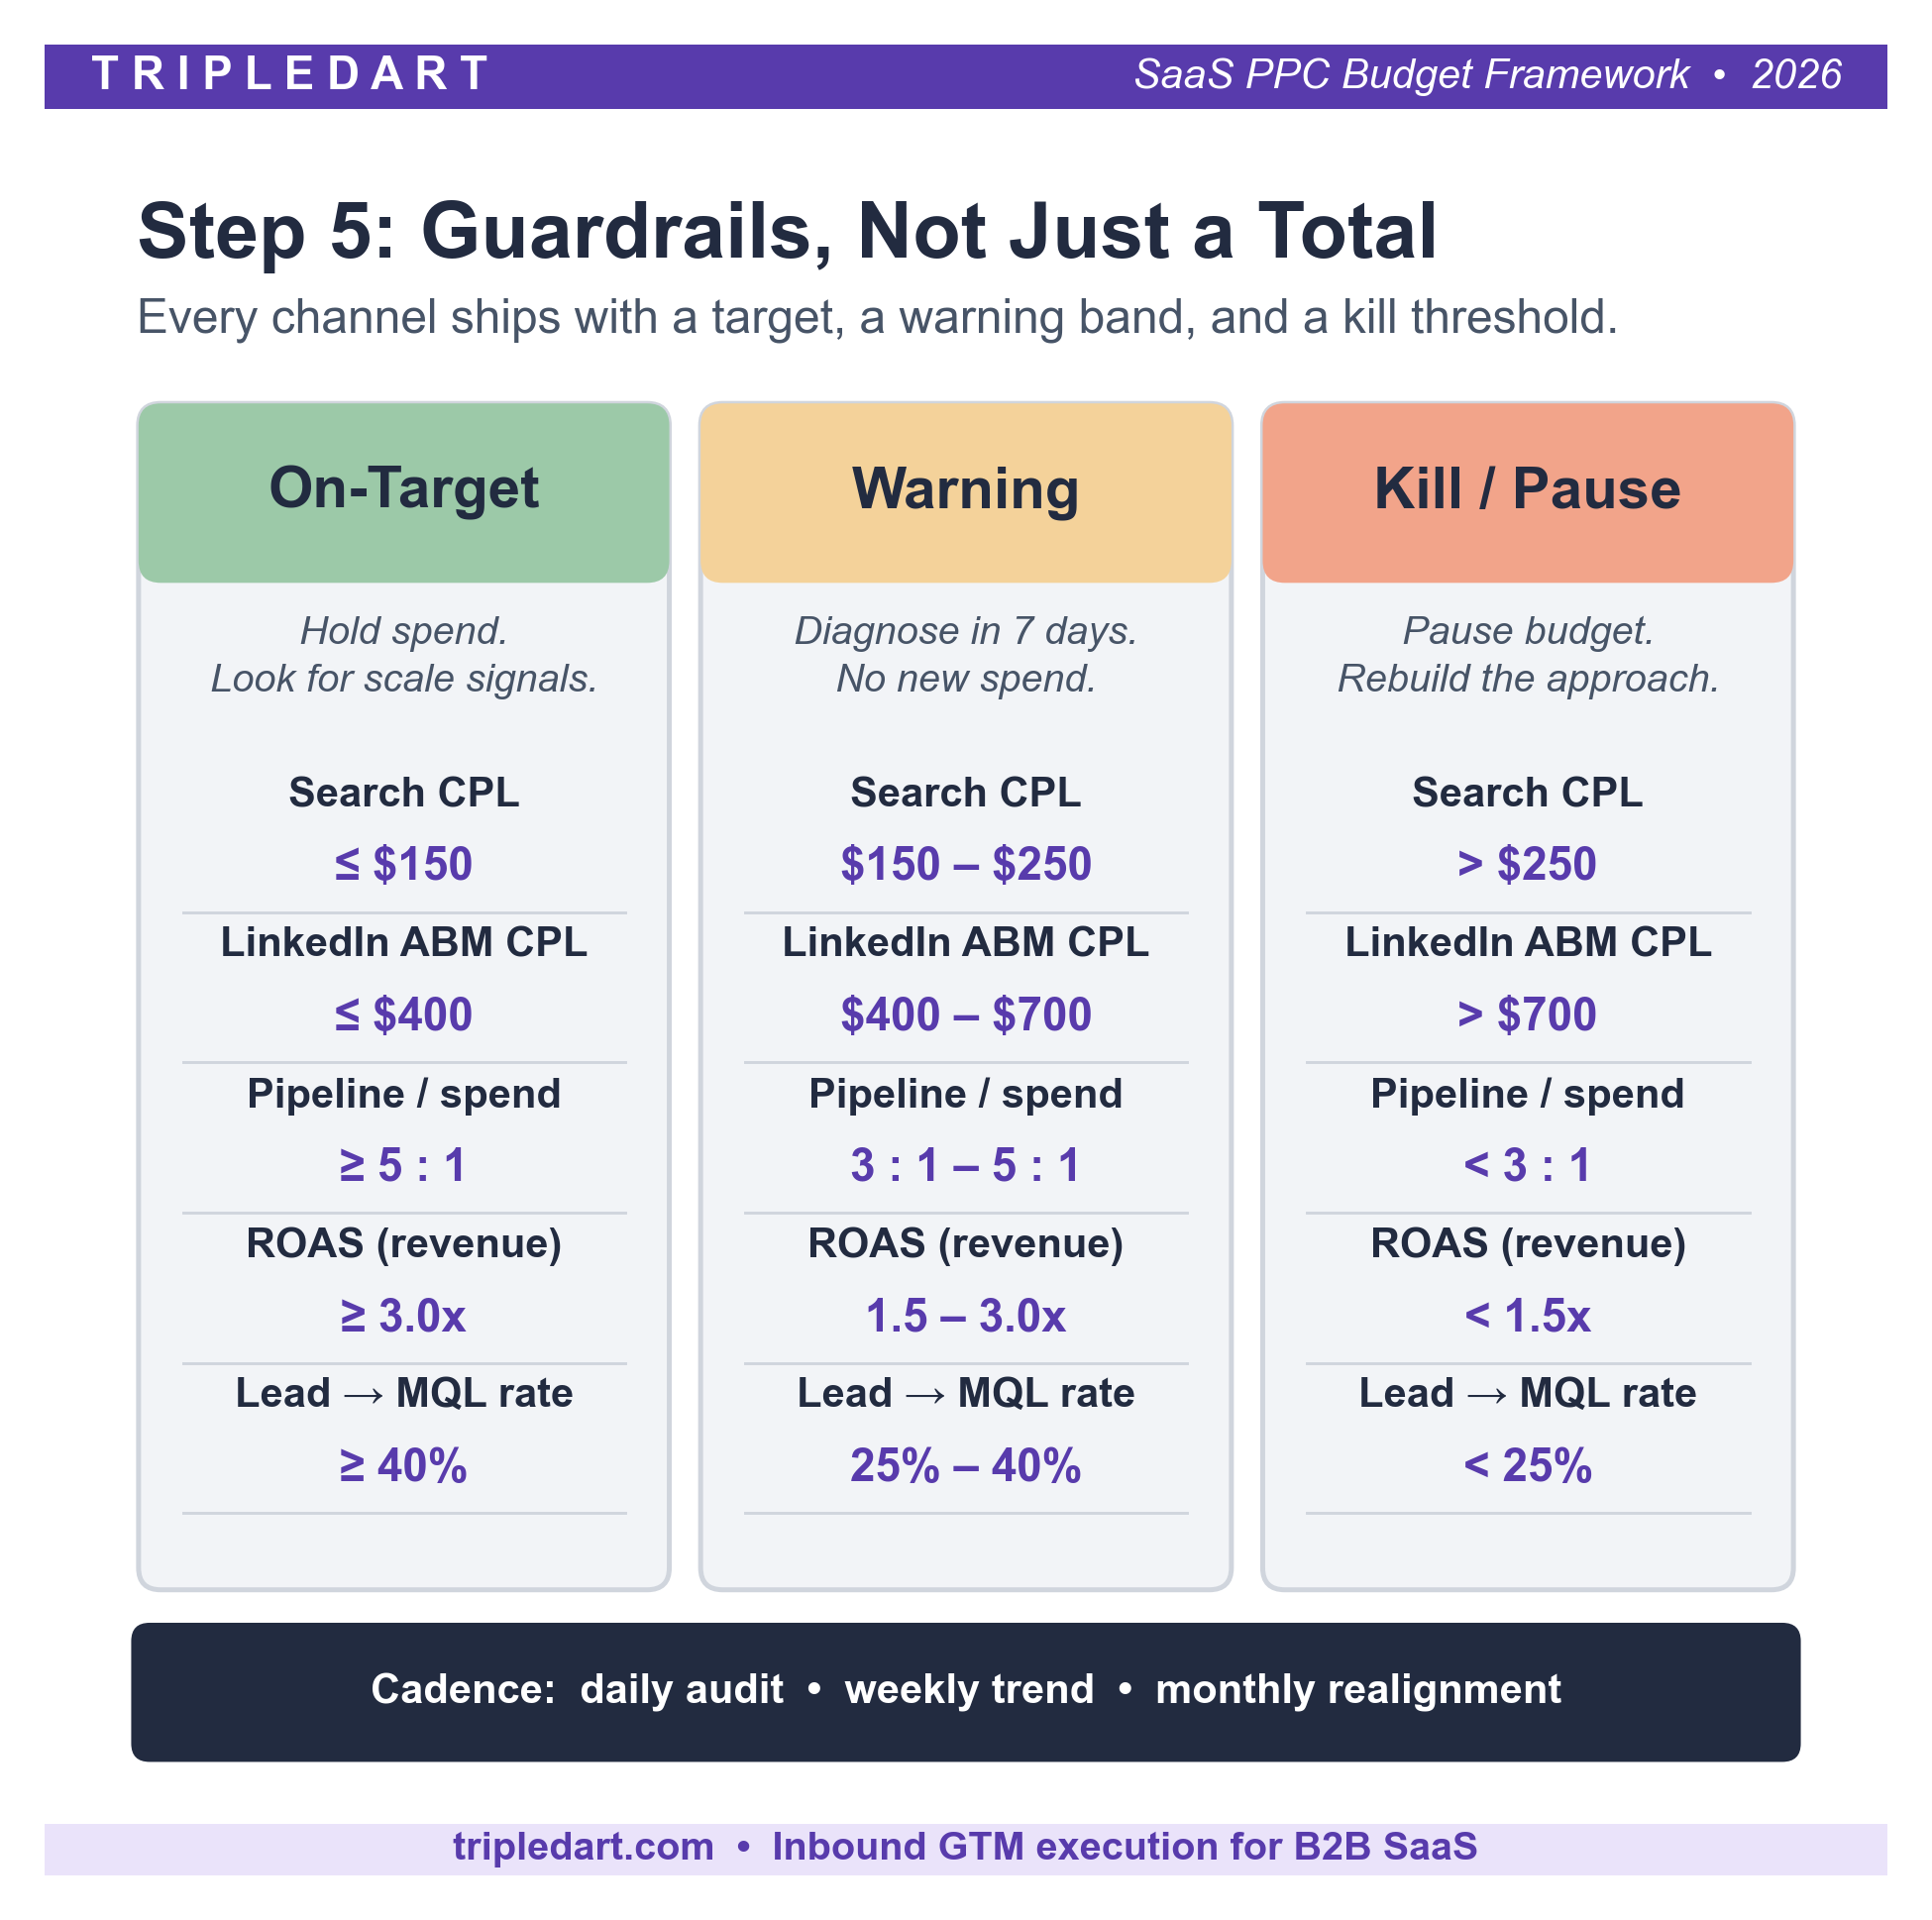
Three principles make the dashboard hold under pressure.
Catch Drift in the Warning Band
By the time a channel hits kill criteria, the team has already burned a month of spend on a problem that was visible three weeks earlier. The warning band is the diagnostic surface, designed to flag drift while there is still runway to correct it. Treat any metric in the warning band as a 7-day fix-it ticket with a defined owner, and decline the tempting 30-day "let's see how it trends" runway. Channels that get the 30-day runway almost always end up in the kill zone anyway.
Daily, Weekly, and Monthly Review Cadences
A SaaS PPC budget needs three cadences running in parallel:
- Daily: an ops audit on paid accounts, under one hour when set up right, catching the small drifts that compound.
- Weekly: a trend review with the CMO surfacing patterns the daily cannot see.
- Monthly: a budget realignment re-cutting spend across channels based on quarterly pacing.
Most SaaS teams run the monthly review well. Few run the weekly. Almost none run the daily at full discipline. The teams that run all three hold plan four quarters in a row, and the compounding across those four quarters separates them from the teams explaining a 20% miss next December.
Honor Kill Criteria Without Exception
The hardest moment in this system is the day a channel the CMO has personally championed crosses into the kill zone and the team frames it as "the channel just needs more time." Honor the kill rule anyway. The moment you teach the system that kill criteria are negotiable, every future kill decision becomes a debate instead of a rule, and the discipline that made the framework work is erased.
For the anchor company, the dashboard holds three metrics per channel, refreshed every Monday morning in a single view the CMO and paid lead both open:
Every Monday the team pulls these numbers, writes a one-line note on each, and acts within the day on anything in the warning band. That is the entire review. Most teams make it more complicated than this. The ones who beat plan do not.
If you want a quick gut check on your current setup before redesigning anything, our PPC ROI calculator returns a starting view in about five minutes.
You have walked a $5M ARR SaaS from a revenue target to a weekly dashboard. The $75K that dropped out of Step 1 is now a live operating system with guardrails, a defense reserve, and a cadence. The last question is whether your specific stage of company fits the shape the framework assumes.
How Much Should Your B2B SaaS PPC Budget Be in 2026?
Most B2B SaaS PPC budgets in 2026 land between $30K and $250K per month, with the specific number shaped by ARR, growth stage, ACV, and vertical. The table below shows the ranges we see most often across our portfolio of 250+ B2B tech engagements.
These ranges align with broader 2026 benchmark data. Industry PPC management fees typically land between $1,000 and $10,000 per month (separate from ad spend) depending on account complexity. Gartner's CMO survey puts SaaS marketing spend between 11% and 15% of revenue at the high end, with paid media taking 25% to 45% of that total.
For a sharper sanity check, the table below shows the live portfolio benchmarks we are seeing this month across the active B2B SaaS accounts we manage on Google Ads and Meta Ads. Use these as the ceiling check on the per-channel guardrails inside Step 5.
The number you land on only holds up if it clears the Step 1 to Step 5 walk. Getting there with a percentage of ARR and last year's ratios will produce a number. Getting there with the walk will produce a budget.
Putting the Framework Into Practice
Put the framework into practice by running the five steps in order: reverse-engineer the total from revenue, gate it on unit economics, split it 60/25/15 across channels, buffer it for CPC inflation, and guard it at the channel level. Each step hands the next a cleaner input than the one before, and by Step 5 the budget has stopped being a document and started being a process.
None of this is new math. The work is rare in the wild because weekly discipline is hard and building the model the first time feels boring next to "just launching campaigns." The first round of work is where the compounding originates.
This is the work our SaaS PPC team owns at TripleDart: the budget framework, the channel execution, the weekly cadence, and the pipeline number that comes out the other end.
We have run this walk with most of the 250+ B2B tech companies we have partnered with, across more than $150M in managed ad spend. The five-step shape holds. The numbers inside move with the ICP, the ACV, and the sales motion.
Case Study: SpotDraft
SpotDraft, a contract management platform, scaled demo bookings 4x and grew paid-sourced pipeline 8x under the same framework. Drew Wallace, Performance Marketing Manager at SpotDraft, says: "TripleDart has been a dream partner. The team is intelligent, responsive, and delivers what they promised." Read the full SpotDraft case study.
If you are heading into your 2026 planning cycle and want a second set of eyes on the budget before it lands in front of the board, book a strategy call. We will walk your funnel, your CAC math, and your channel mix in the first hour. Whether you work with us afterward is up to you. Either way, you leave the call with a sharper plan than the one you walked in with.
Frequently Asked Questions
What percentage of revenue should a B2B SaaS company spend on PPC in 2026?
B2B SaaS companies typically spend 11% to 15% of revenue on total marketing in 2026, with paid media taking 25% to 45% of that total, according to HubSpot CPL and CAC benchmark research. Early-stage SaaS often pushes paid above 50% of marketing spend, while mature SaaS in efficiency mode runs paid below 30%.
How do I calculate a PPC budget if I do not know my LTV yet?
Use a gross-margin-adjusted ACV as a proxy for first-year contribution and cap paid-attributable CAC at a 12-month payback ceiling. Once you have six to nine months of cohort data, replace the proxy with real LTV. Until then, keeping paid-attributable CAC below gross-margin-adjusted ACV prevents digging a hole retention cannot fill.
Should I budget for Google Ads and LinkedIn ABM separately or as one paid bucket?
Budget Google Ads and LinkedIn ABM as separate lines, because they have different conversion windows, different attribution shapes, and different roles in the funnel. Mixing them in one bucket masks which channel is producing pipeline. Use the 60/25/15 starting split as the structural separation. Ahrefs' breakdown of how PPC and SEO work together makes a parallel point for cross-channel planning.
How often should a SaaS PPC budget be reviewed and reset?
A SaaS PPC budget should be reviewed weekly at the channel level (CPL, ROAS, kill criteria), monthly at the budget pacing level, quarterly at the strategic allocation level, and annually at the LTV:CAC and total-spend level. Most SaaS teams collapse all four reviews into a quarterly check-in and miss the operational signals that surface week to week.
What is the minimum monthly PPC budget for a B2B SaaS company to see meaningful results?
The minimum monthly PPC budget for meaningful B2B SaaS results is $10K, and below that number the spend is a pilot, not a program. Between $10K and $30K, one channel can run well. Between $30K and $100K, a real two-channel mix becomes possible. Above $100K, the framework above has more impact than any single tactic. Our SaaS marketing agency cost guide breaks down what to expect at each band.
Do I need to budget for AI-driven campaign types (Performance Max, Demand Gen, Advantage+) separately?
Treat AI-driven campaign types (Google Performance Max, Google Demand Gen, Meta Advantage+) as test budget for the first two quarters because the spend allocation inside them is opaque and their reporting blurs cross-channel attribution. Once you have six months of clean data on incremental conversions, promote them into the main budget split.
Should B2B SaaS companies manage PPC in-house or hire an agency?
Below $10K per month in ad spend, an in-house or freelance specialist usually holds up. Above $30K per month with two or more channels running, an agency typically delivers stronger ROI because the work spans paid media, creative, landing-page CRO, and attribution. Industry benchmarks put agency management fees at 10% to 20% of ad spend or $1,000 to $3,000 per month on flat-fee models.
.webp)


.webp)
.webp)

.png)


.png)


.webp)


.webp)

.webp)


%20(1).png)


.webp)
.webp)
.webp)


%20Ads%20for%20SaaS%202026_%20Types%2C%20Strategies%20%26%20Best%20Practices%20(1).webp)


.webp)


.webp)


![Creating an Enterprise SaaS Marketing Strategy [Based on Industry Insights and Trends in 2026]](https://cdn.prod.website-files.com/632b673b055f4310bdb8637d/6a218bacea463474377dfd32_34%20-%20Creating%20an%20Enterprise%20SaaS%20Marketing%20Strategy.png)


.webp)


%20Agencies%20for%20B2B%20SaaS%20Compared%20(2026).webp)

.webp)
%20with%20Hubspot.webp)


_%20Expert%20Reviews%20%26%20Comparisons.png)


.webp)


_%20Comparison%2C%20Strengths%2C%20and%20How%20to%20Choose.png)


.webp)


.webp)


.webp)


%20Tools%20in%202026_%20Vetted%20List.webp)


![How to Measure AEO Success: 12 Metrics Beyond Clicks [2026 Framework]](https://cdn.prod.website-files.com/632b673b055f4310bdb8637d/6a0d664b326187e99b3d5960_6%20-%20The%20Ultimate%20Guide%20to%20Measuring%20AEO%20Success%20in%202026.png)
![7-Step Workflow for AEO-Ready Content [2026 Framework]](https://cdn.prod.website-files.com/632b673b055f4310bdb8637d/6a0d55ea88913ede1d3a7123_5%20-%20Workflows%20for%20Optimized%20AEO-Ready%20Content%20Creation.png)
.png)
![How to Structure Content for AEO and GEO [With Templates]](https://cdn.prod.website-files.com/632b673b055f4310bdb8637d/6a0c6a56eb700472e635ff33_1%20-%20How%20to%20Structure%20%20Content%20for%20AEO%20and%20GEO%20%20Summaries%20(2026).png)


.png)
.png)


.png)

.png)
.png)


%2520Agencies%2520(2025).png)

![Top 9 AI SEO Content Generators for 2026 [Ranked & Reviewed]](https://cdn.prod.website-files.com/632b673b055f4310bdb8637d/6858e2c2d1f91a0c0a48811a_ai%20seo%20content%20generator.webp)


.webp)
.webp)
.png)


.png)


.webp)


.avif)