.png)

Problem Statement
As a performance marketers, there is no doubt to admit that its always been challenging to control your unit metrics. Three common questions that we always have in our mind while running paid campaigns,
1. My CPL is high for this campaign, am I overspending?
2. What is the right threshold of CPL, cpMQL to operate at for my campaigns? What should be my tCPA be?
3. How do I look beyond CPL, cpMQL to understand my spending potential?
4. I am just setting up a new ads account, how do I plan my budgeting and scale effectively?
If you're starting from scratch or rebuilding your paid program, our SaaS PPC strategy guide covers the full pre-launch checklist - including how to set baseline CPCs, calculate your required budget, and structure campaigns by funnel stage before spending a dollar.
What (and Why) Exactly are Unit Metrics to Consider for Paid Media
Paid Pipeline Metrics:
1. CPL (its obvious!) : Cost for each lead generated.
2. cpMQL : Cost for each Marketing Qualified Lead
3. cpSQL : Cost for each Sales Qualified Lead
4. cpOpp : Cost for each Opp
These metrics largely depend on industry, channels, CPC etc, and hard to really define benchmarks unless you compare with similar industries.
Account Efficiency Metrics :
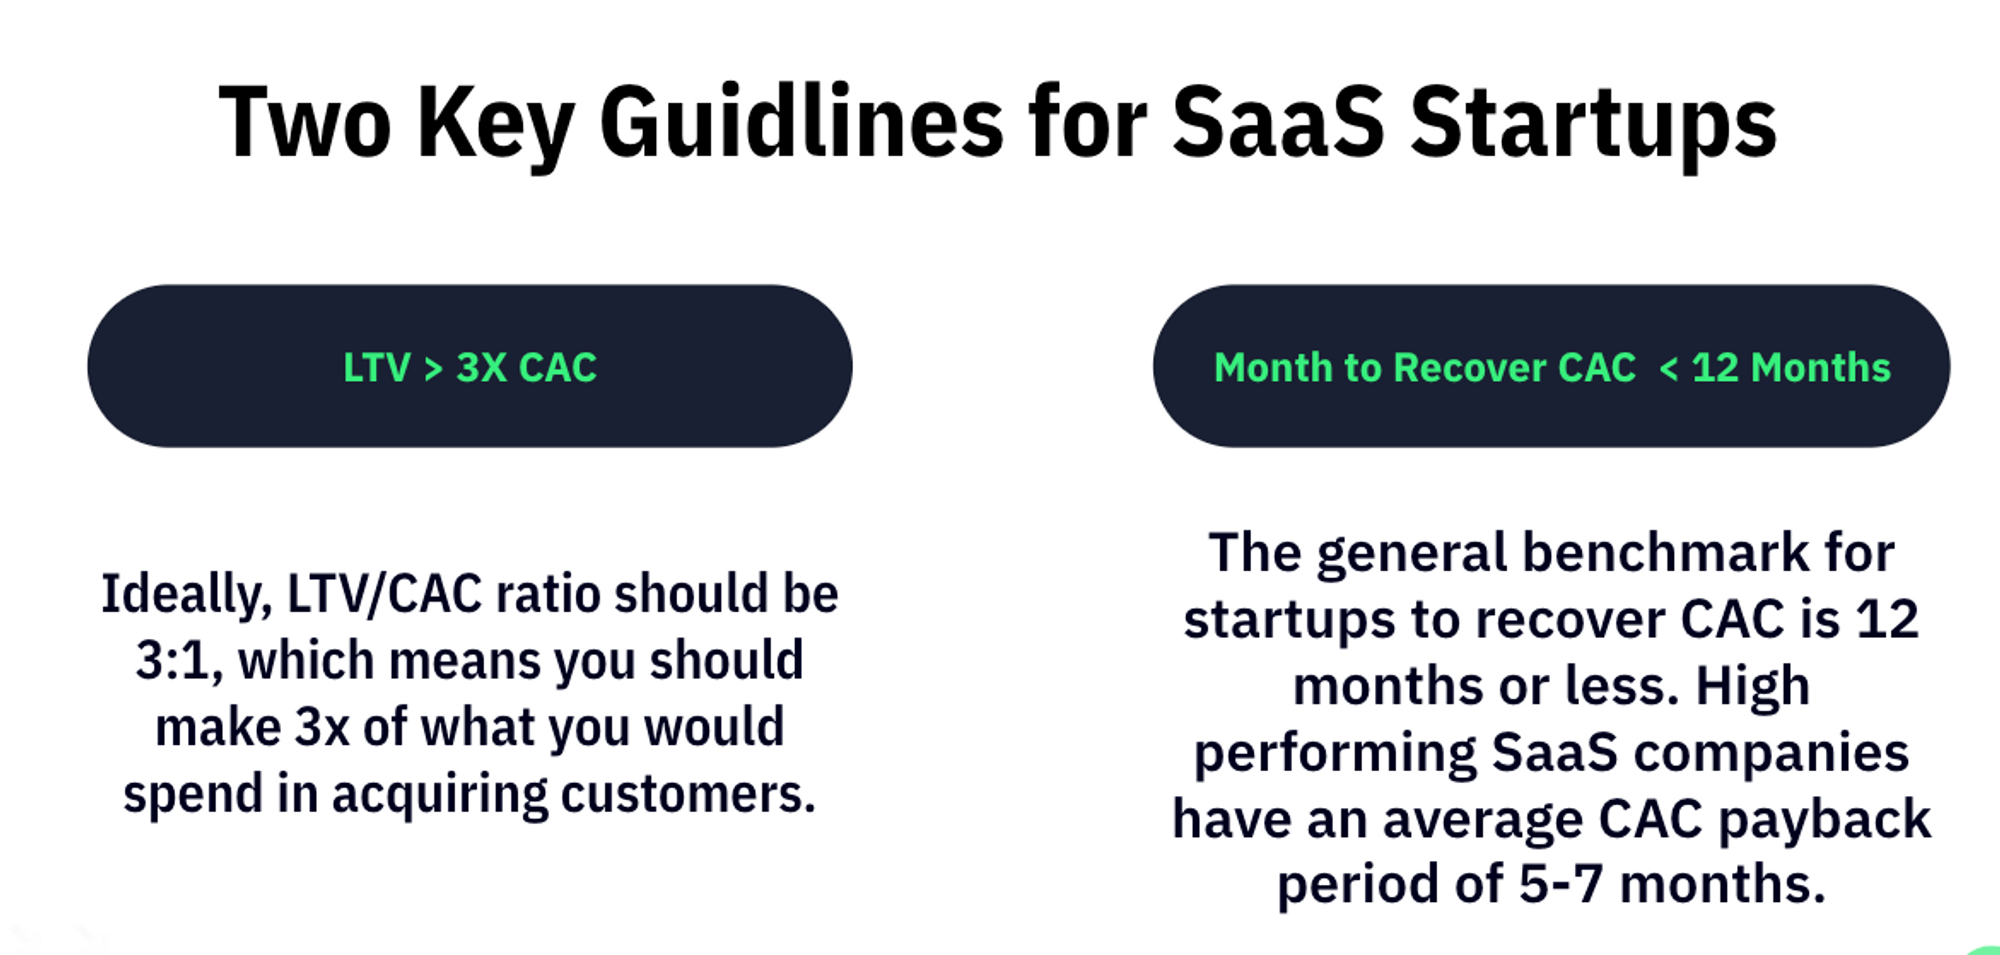
1. CAC : CAC refers to the amount you spend to acquire each new customer. To calculate it, divide your combined sales and marketing expenditure by the number of new customers it generated. Lower it is better.
2. LTV : Its measure of how many times of revenue you make out of your CAC. Higher it is better.
3. CAC Payback : The time it takes in months to recoup the cost of acquiring a customer. Lower it is better.
4. Pipeline to Spend % : Its measure of how much % you are spending out of your total pipeline generated. This number depends on stage of company, regions, channels based on brand strength, cost optimisation etc. Lower it is better but if its too low you are under spending and might have a high opportunity cost involved.
Ideally these four metrics are much needed for marketer to understand how the paid channel is heading and gives you direction or course correct if needed.
Understanding your current funnel in 3 Steps:
1. How is my funnel looks like : Evaluate your funnel across different channels
2. What are my current spends and other costs involved:
3. What are my unit metrics coming to
Now, lets understand how do we derive optimal numbers based on your funnel metrics,
Approach 1 : (Cost Optimisation)
Mathematical Bottom Up Approach to Arrive at Right CPL (till cp-OPP)
Inputs to consider : Pipeline to Spend %, Pipeline Target, funnel metrics in %
Outputs : Budget Required, CPL, Leads to be generated
When to use :
1. You know what is spend to pipe ratio you would to operate at
2. You know what is your pipeline target
3. You know very well on how your funnel looks like (Lead → MQL → SQL → Opp)
Case 1 :
Now, consider you would like to operate at 20% Pipeline to Spend Ratio with pipeline target of $250k with ARR of $45k, it makes sense to spend upto $243 for a lead and close to $810 for MQL. Be cautious that LTV:CAC and CAC Payback is likely to be on higher end. In this case, you will able to generate 185 leads at $243 CPL at 20% Pipeline to Spend Ratio with pipeline of $250k with $45k budget.
Case 2 :
Now, consider you would like to operate at 10% Pipeline to Spend Ratio with same pipeline target of $250k with ARR of $45k and at more safer LTV:CAC and CAC Payback ratio, you are no longer supposed to spend more than $108 for a lead and close to $360 for MQL.
In this case, you will able to generate 185 leads at $108 CPL at 10% Pipeline to Spend Ratio with pipeline of $250k, and your budget comes down to $20k
PS: Arrive to your Pipeline to Spend ratio cautiously, it might not be easy if you want to target 10% S2P if you are currently operating at 20% S2P, and can’t reduce CPL from $243 to $108 in one go. Evaluate your funnels based on different cuts like channel, region and plan for incremental optimisation.
Approach 2 : (Scale to Max Potential)
Mathematical Top Down Approach to know your Right CPL (till cp-OPP)
Inputs to consider : Marketing cost, CPL, funnel metrics in %
Outputs : Spend_to_Pipeline, Pipeline, Leads to be generated
When to use :
1. You have budget in hand.
2. You have CPL in mind and want to understand what is the best number you can achieve
3. You know very well on how your funnel looks like (Lead → MQL → SQL → Opp)
4. You are not too constrained on S2P and maximise your pipeline and be flexible with your CPL
Case 1 :
Consider you are able to operate your funnel with at Marketing cost of $40k and CPL of $100, you are likely to get 400 leads and $540k pipe with 8% S2P at optimal LTV:CAC & CAC payback.
Case 2 :
Consider you are able to work on your funnel metrics (Lead to MQL % etc) and make it better than Case 1, for same Marketing cost of $40k it is okay to spend even $240 for a lead for same $540k pipe with 8% S2P, just that your count of leads will get reduced.
Bonus : This sheet automates your calculation, all you need to do is enter the input metrics marked in yellow.
Deriving your right tCPA at Campaign Level :
While planning the same at campaign level, its okay to keep the keep the calculation simpler, all you need is what is your historic S2P for each campaign.
Consider this, you are running three paid search campaigns with varied performance in terms of leads, Opp % etc.
From the current set of campaigns, campaign 1 and 2 are currently operating at close to 18% P2S but at varied CPL, lets try to understand its ideal tCPA while we continue to optimise,
Campaign - 1 (Competitor) :
- You wanted to improve CTR from 3.6% to 4%
- You wanted to improve CVR from 0.6% to 1%
You are likely to get 7 leads from 4 at more or less same cost of $17k. This boils down to your tCPA of $2.3k
Similarly, for campaign 2 you have scope to optimise CPL from $1.2k to $1k if CTRs and CVR can be improved.
Now comes the interesting part of campaign 3 which is currently at 22% P2S at $732 CPL. Now this campaign at its best can generate upto 14.59% P2S even if we increment CTRs and CVR, so its again important to understand what is the best case a campaign can operate at while looking for P2S. So ideal tCPA can be $500 at 15% P2S but this campaign cant generate 10% P2S at current setup unlike campaign 1.
Closing Notes :
In conclusion, its always important to look beyond your CPL and optimise campaigns at Pipeline to Spend % to scale profitably. Backtrack the metrics and then understand what is the best CPL you can operate it. This helps you to ensure you are not burning a lot and helps to scale/optimise campaigns with clear direction in hand.
Reach out to our saas ppc agency for any queries. TripleDart will be happy to help and you can book a call here.

.png)


.webp)


.webp)


.webp)

.webp)
.png)


%20(1).png)


.webp)
.webp)
.webp)


%20Ads%20for%20SaaS%202026_%20Types%2C%20Strategies%20%26%20Best%20Practices%20(1).webp)


.webp)


.webp)


![Creating an Enterprise SaaS Marketing Strategy [Based on Industry Insights and Trends in 2026]](https://cdn.prod.website-files.com/632b673b055f4310bdb8637d/6a218bacea463474377dfd32_34%20-%20Creating%20an%20Enterprise%20SaaS%20Marketing%20Strategy.png)


.webp)


%20Agencies%20for%20B2B%20SaaS%20Compared%20(2026).webp)

.webp)
%20with%20Hubspot.webp)


_%20Expert%20Reviews%20%26%20Comparisons.png)


.webp)


_%20Comparison%2C%20Strengths%2C%20and%20How%20to%20Choose.png)


.webp)


.webp)


.webp)


%20Tools%20in%202026_%20Vetted%20List.webp)


![How to Measure AEO Success: 12 Metrics Beyond Clicks [2026 Framework]](https://cdn.prod.website-files.com/632b673b055f4310bdb8637d/6a0d664b326187e99b3d5960_6%20-%20The%20Ultimate%20Guide%20to%20Measuring%20AEO%20Success%20in%202026.png)
![7-Step Workflow for AEO-Ready Content [2026 Framework]](https://cdn.prod.website-files.com/632b673b055f4310bdb8637d/6a0d55ea88913ede1d3a7123_5%20-%20Workflows%20for%20Optimized%20AEO-Ready%20Content%20Creation.png)
.png)
![How to Structure Content for AEO and GEO [With Templates]](https://cdn.prod.website-files.com/632b673b055f4310bdb8637d/6a0c6a56eb700472e635ff33_1%20-%20How%20to%20Structure%20%20Content%20for%20AEO%20and%20GEO%20%20Summaries%20(2026).png)


.png)
.png)


.webp)

%20Agencies%20in%202027.webp)
.webp)
![Top 9 AI SEO Content Generators for 2026 [Ranked & Reviewed]](https://cdn.prod.website-files.com/632b673b055f4310bdb8637d/6a2a3e3105bc1a127aae4e8e_34%20-%20Top%209%20AI%20SEO%20Content%20Generators%20for%202026%20%5BRanked%20%26%20Reviewed%5D.webp)


.avif)