.png)
Key Takeaways
- Do not split a search campaign until the parent is running at 60+ conversions a month. Below that, each child campaign starves the bidder.
- When a competitor starts bidding hard into your branded auction, Target Impression Share is the only bid strategy that holds.
- On LinkedIn audiences under 1,500 accounts, Manual CPC beats automated bidding by 70% to 90% on efficiency. The bidder cannot converge without signal.
- AI Max is a rolling test regime, not a single decision. The winning variants consistently had tROAS targets 20% to 30% below the account baseline.
- Performance Max absorbs branded search traffic by default. If you have not pre-loaded brand terms as negatives, your PMax report is overstating its own contribution.
- The single biggest optimization we are making in Q2 is not inside Google Ads. It is a HubSpot lifecycle fix that pushes SQL signal back into the auction.
What This Report Is and Who It's For
If you run paid media for a B2B SaaS brand, Q1 2026 probably looked like one of three things in your account.
- Your brand Impression Share drifted down because a competitor started bidding hard into the category
- Your paid search MQLs held volume but the quality quietly dropped
- Your finance team asked you to grow pipeline on less budget, and you are still working out what to cut
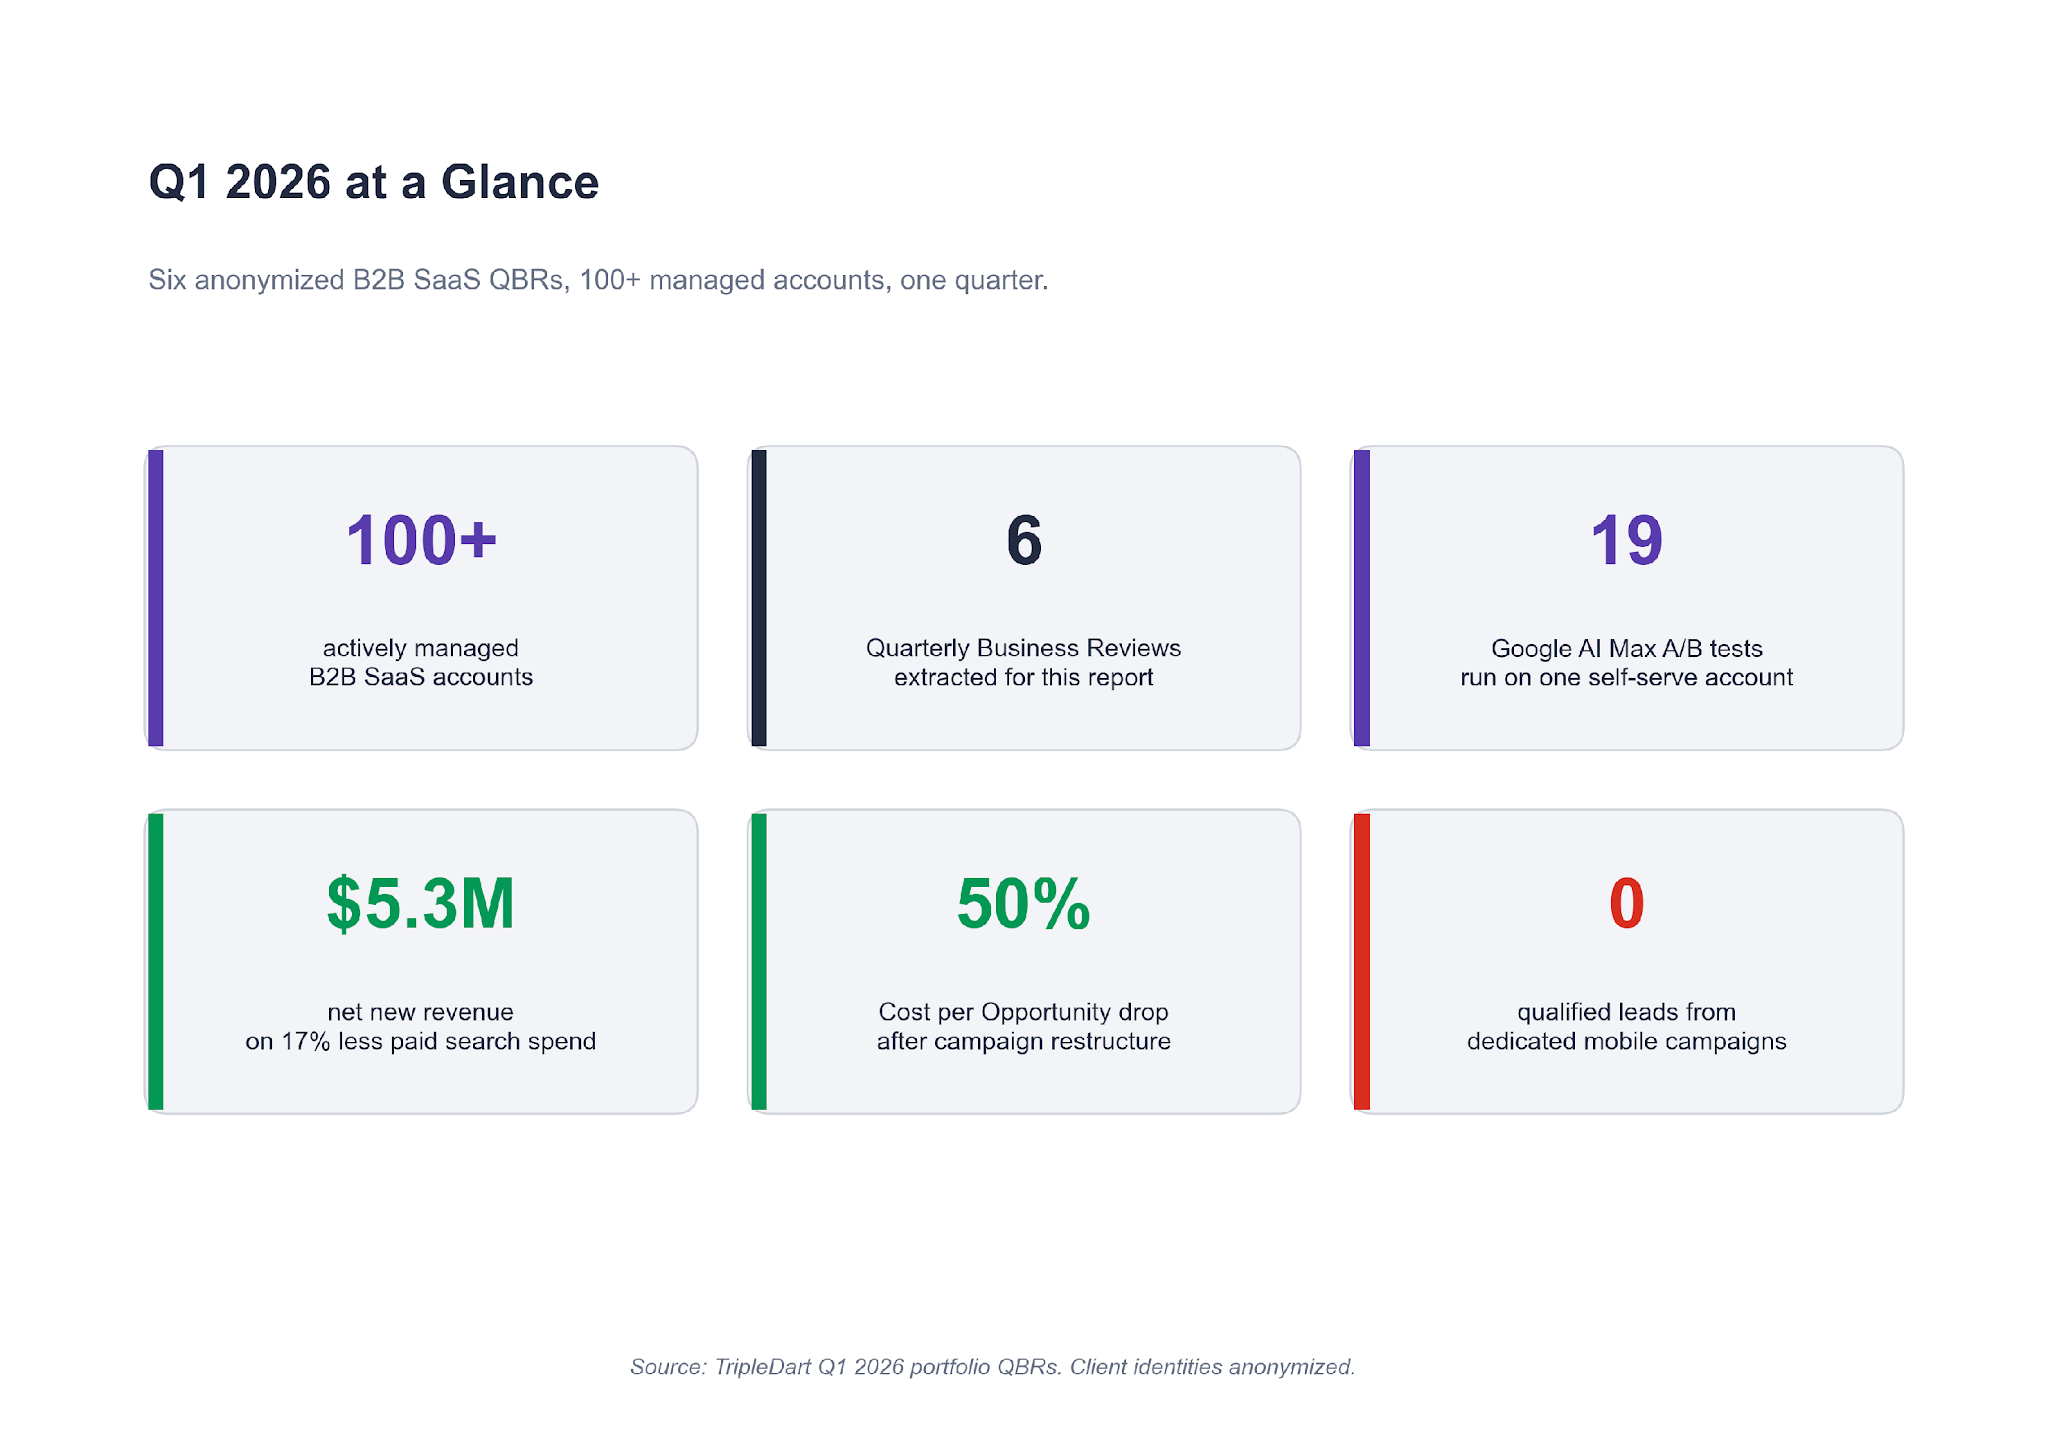
All three showed up across the 100+ B2B SaaS paid accounts we run.
This report pulls six of the plays that worked (and failed) in Q1 2026, taken from the client quarterly business reviews we just closed. Every number is directly from the account. Each story is written as a single lesson you can take straight into your own account.
A note on who this is for:
- If you run paid media on a B2B SaaS brand between Series A and late-stage, every lesson here applies directly.
- If you advise CMOs on paid strategy, the five checks at the end give you a clean diagnostic to run on any account you pick up.
- If you are a founder weighing whether to hire a paid agency, the six stories give you a feel for what a good quarterly review surfaces. And for what a bad one misses.
Before the six lessons, a short market update. Three pressures changed SaaS PPC entering Q1 in ways most dashboards have not caught up to yet. The six lessons are easier to read once those pressures are named.
Three Pressures on SaaS PPC Entering Q1 2026
The three pressures below were live in every account we ran this quarter. You are probably seeing at least two of them in your own.
Pressure 1. AI Max became the default
In late 2025 Google moved AI Max for Search from an opt-in test to the default treatment on new Search campaigns. That forced a question in every account we run. Keep manual control, or let the bidder expand match and bid on your behalf? We had been tracking this in our Google Ads for SaaS guide all through Q4. Five of our six QBR accounts ran at least one AI Max test this quarter.
Pressure 2. NA bottom-funnel CPCs crossed the $6 line
On one self-serve account we run, US CPCs on category keywords landed between $4.80 and $6.40 through Q1. That ceiling changes the unit economics of paid search on any SaaS brand with a blended CAC target under $120. You do not scale around a CPC that is structurally incompatible with your payback window. You segment around it, or you move budget into cheaper auctions.
Pressure 3. AI-agent referral traffic became trackable
Traffic from ChatGPT, Perplexity, and Gemini started landing in HubSpot as a named source on enough of our accounts to matter. On one account, AI-sourced contacts grew 50% quarter over quarter.
The volume is small, typically 2% to 7% of paid-associated contact volume. The growth rate is one-way up. We are not spending against this yet. We are instrumenting it so we can read conversion quality by AI source when we do.
Against those three pressures, here are the six plays that defined the quarter.
Lesson 1: Do Not Split a Search Campaign Until the Parent Clears 60 Conversions a Month
If your search campaign is mixing three intents in one ad group structure, you are probably thinking about splitting it. Before you do, check how many conversions the parent campaign delivered last month.
One account we run is a B2B SaaS selling messaging APIs. Its catch-all WhatsApp Search campaign in India was mixing Chatbot queries, OTP queries, and general cloud queries in one bidder. The search terms report was noisy. The bidder was averaging across three intents. And we could not read which intent produced the opportunities sales closed.
We split the catch-all into three dedicated campaigns, one per intent, same total budget. Each campaign got its own ad copy, landing page, and bid strategy. The split gave three separate bidders cleaner signal to train on.
The numbers after a full quarter:
- The original campaign, now isolated, delivered +9% conversions and -22% CPA versus pre-split baseline.
- Net-new conversion volume appeared from the Chatbot and OTP campaigns that had been invisible in the consolidated reporting.
- Cost per Opportunity on the account's APAC region fell from €10,298 to €5,174 in the quarter. A 49.8% reduction.
A second account had tried the same play before we took it over, and lost money doing it. The previous setup had split a Generic campaign into narrower intent segments (RFP-specific, vendor-specific, AI-specific). Spend on the RFP sub-campaign: $1,583. Conversions: one. And that one conversion came from a search term that was not RFP intent at all.
The difference between the two accounts was volume. Google's Search bidder needs roughly 30 conversions a month to train. Split a campaign with 90 monthly conversions into three, and each child sits at 30. Split one with 45 conversions into three, and every child starves.
What this means for your account
Before splitting any Search campaign, look at the parent's last 30 days of conversion volume. If it is under 60, the split will fragment signal the bidder was already using. If it is over 60, the split will give each child room to train. Campaign structure decisions pay off harder than creative decisions on B2B SaaS search, and this is the first one to get right.
One tell that a split has already gone wrong. In the weeks after you launched the child campaigns, the parent's conversion rate softened. None of the children crossed their target CPA. If that is the pattern on your dashboard, the parent was probably sub-scale to begin with.
The cleanest fix is to re-consolidate. Let the bidder re-train on the combined signal for three to four weeks. Only consider splitting again once aggregate conversions cross the threshold.
Lesson 2: When Competitors Bid on Your Brand, Target Impression Share Is the Only Answer
Brand Impression Share is the quietest leak in a B2B SaaS account. It drifts down slowly, and by the time you notice it on a quarterly dashboard you have lost pipeline that was cheaper than any other channel could deliver.
That is what had happened on a mid-market B2B SaaS account entering Q1. Brand IS was sitting at roughly 57% after two quarters of a named SaaS competitor bidding aggressively into the category. The Brand campaign was on Target CPA, which was capping spend at exactly the moment the auction needed more aggression.
We moved the Brand campaign from Target CPA to Target Impression Share at 95%. Same ad copy, same landing pages, same budget. The change was a bid strategy swap on an existing campaign.
Brand IS rebuilt from 57% to over 90% in six weeks. Brand CPL held. Brand volume recovered. The pipeline that had been leaking to the competitor's ad stopped leaking.
The reason Target CPA fails in this scenario is simple. When a competitor enters the auction, click prices rise. A Target CPA bidder will not bid past its CPA target, so it walks away from clicks that are still profitable given your LTV:CAC math. You end up yielding high-intent branded traffic to a competitor that is probably overpaying to get it. Before we made this switch, the same account had already tried two scale experiments that both failed.
The first had been moving the Generic campaign to Target CPA. Spend: $3,300. Conversions: zero. Moving a sub-scale campaign to tCPA starved the bidder of exploration budget and it stopped firing entirely.
The second was the intent split we walked through in Lesson 1. That also failed, for the same volume reason.
What this means for your account
If a competitor is actively bidding on your brand terms, do not let a Target CPA cap the bid. Switch the Brand campaign to Target Impression Share at 90% to 95% and let the bidder defend the auction.
You are not growing spend for the sake of it. You are refusing to yield the cheapest clicks you have to a competitor paying to steal them. The SaaS PPC pillar has the full framework for defending brand search across a mid-market account if you want the deeper read.
Lesson 3: A Budget Cut Is the Cheapest Restructure You'll Ever Get
Most paid media teams treat a budget cut as a problem. On one mature payments-infrastructure account we run, the Q1 cut was the forcing function that unlocked the best quarter in two years.
Finance pulled 17% out of paid search after Q4. The brief was to hold MQL volume flat or better while paid social scaled alongside on fresh Reddit and LinkedIn tests. A mandate like that tends to go one of two ways. Accounts that chase back to the old volume target lose ground. Accounts that treat the cut as a structural reset recover the quality they had been masking.
We used the cut to run three restructures on this account.
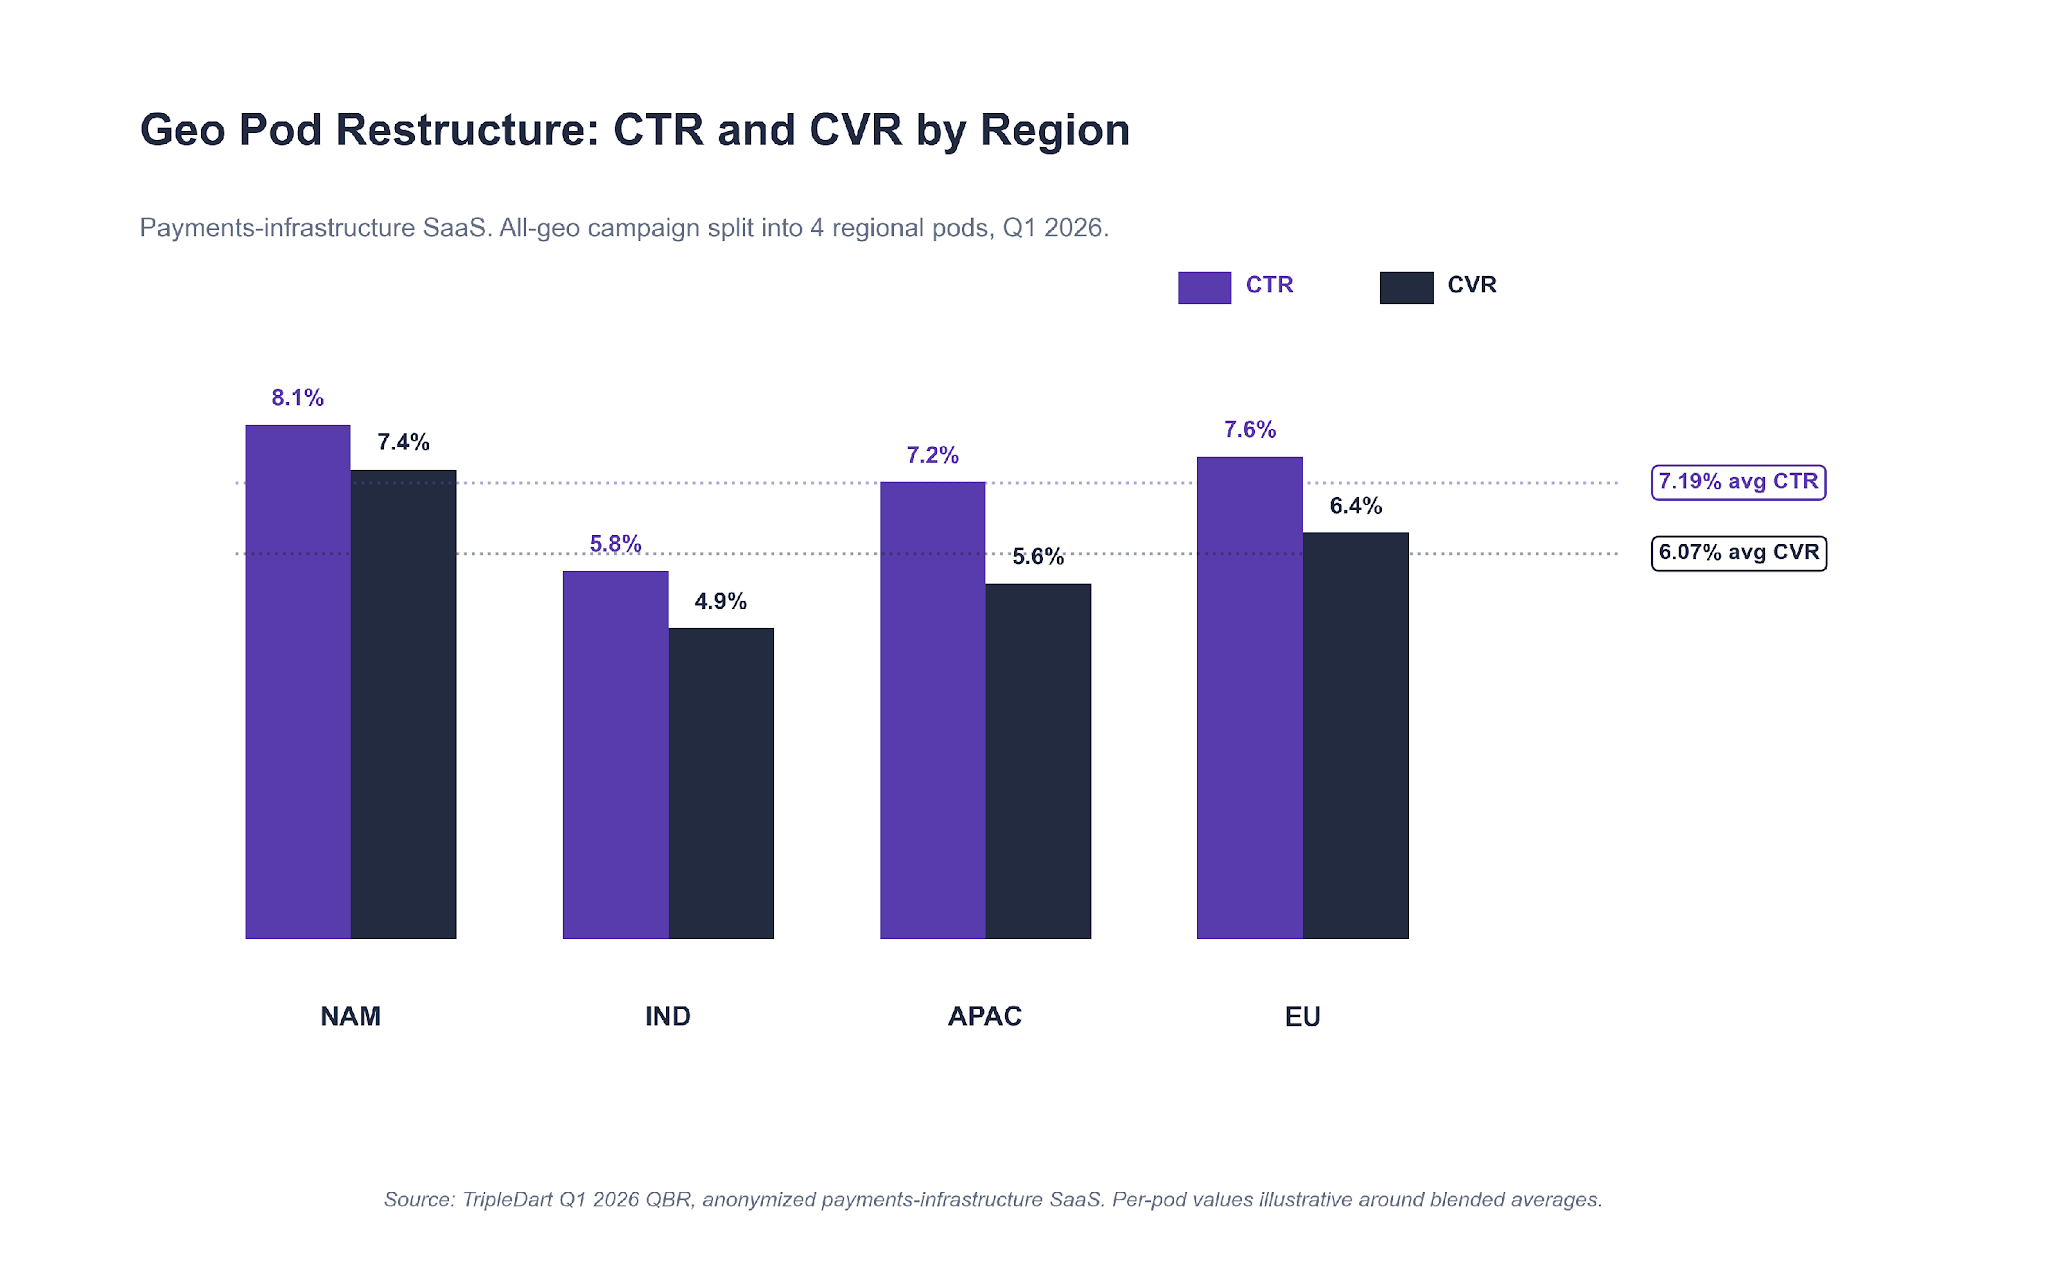
The All-Geo Campaign Got Broken Into Four Regional Pods
The account's all-geo competitor Search campaign was delivering on aggregate. It was also hiding wildly different CVR by region. We broke it into NAM, IND, APAC, and EU. Same creative, regional budget caps, regional negative keywords on each.
Blended across the four pods: 7.19% average CTR and 6.07% CVR. More important, India stopped cannibalizing click volume from the higher-LTV North American auctions. Each pod trained on its own regional signal.
Paid Search Chased MQL Quality, Not Volume
We cut the spend and shifted it. Paid search MQLs came in at +46% quarter over quarter. Cost per MQL dropped from $1,700 to $1,100, a 32% reduction. Net-new revenue from paid search hit $5.3M, a 66% lift on 17% less absolute spend.
The fewer-leads-higher-quality pattern held every week after week three.
Reddit Ran Full-Funnel From Day One
On a different account in Q4, a single-campaign Reddit test had been running before we came in to rebuild it. It failed. Learning from that, on this account we ran Reddit as a three-stage funnel from day one. Awareness video on top, mid-funnel carousel, BOFU retargeting on the exposed audience.
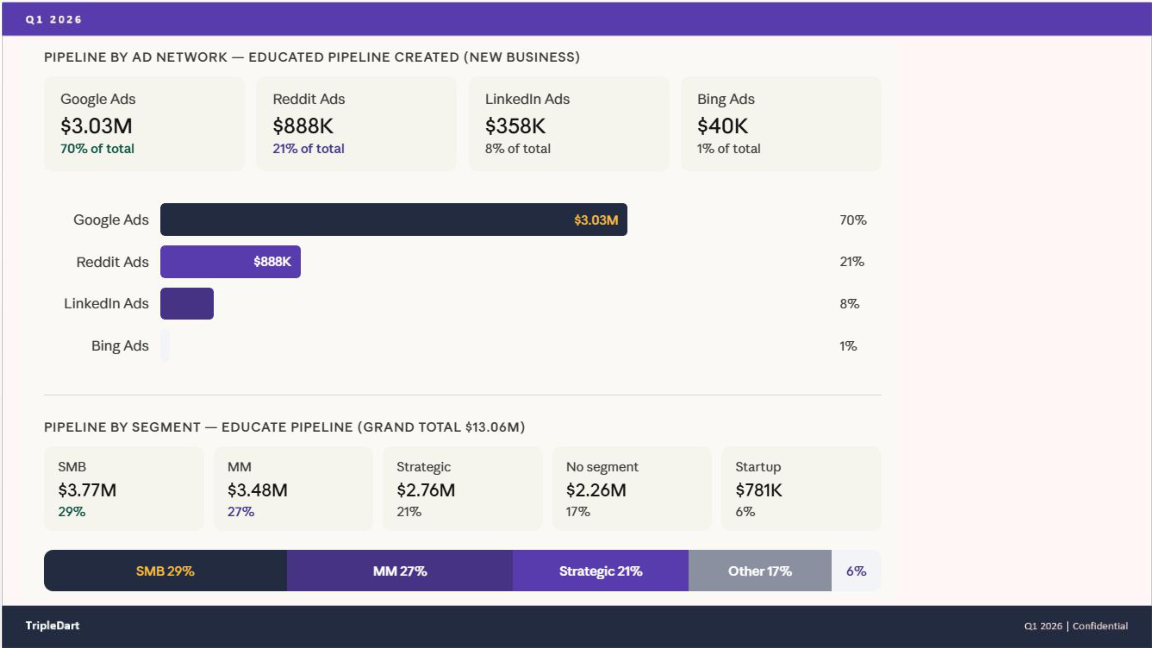
Reddit ended Q1 at 21% of paid pipeline contribution, driving $933K in total pipeline value. Paid social spend dropped 32% in aggregate (from $498K to $337K) while paid social pipeline grew +140% to $1.2M. LinkedIn Thought Leader Ads carried a disproportionate share of the BOFU lift alongside Reddit.
What Full-Funnel Looks Like on Reddit
Single-campaign Reddit tests fail in B2B SaaS. The platform rewards repeated exposure over specific intent, which is the inverse of how Google Search behaves. If you cannot commit three stages at launch, Reddit is not the right channel to test.
What this means for your account
If finance cuts your paid budget, resist the urge to do less of the same thing. Use the cut to force three restructures you have been putting off. Break the geo-blended campaign into regional pods. Move the attribution goal from MQL volume to MQL quality. And if you are launching a new channel, commit to three funnel stages or skip the test.
The 17% cut on this account was the reason $5.3M of net-new revenue surfaced in the quarter. Without the cut, the same pipeline would have stayed buried inside a larger, lower-quality spend base.
One thing worth naming on the psychology of a budget cut. The first instinct is usually to defend the old number, which narrows the conversation to how to buy back the lost volume. Most of the time that instinct is working against the account.
A cut reopens the question of what is actually working, which is the question a quarterly review is meant to force in the first place. When the budget is intact, teams tend to keep running what ran last quarter. When it is cut, there is room to restructure without having to argue for it from scratch.
Lesson 4: On LinkedIn Audiences Under 1,500, Manual CPC Still Wins
LinkedIn's bid algorithms need one of two inputs to converge. Either audience scale they can learn across, or price control they cannot override. If your account gives them neither, the budget goes nowhere useful.
That is what had happened on a B2B SaaS account selling CX tooling into gaming studios. The account's Tier 1 ABM list sat under 1,500 accounts. Per-country audience sizes were below LinkedIn's recommended 300,000 member threshold. The automated bidder was overspending on impressions because it could not find enough click signal to train on. CPMs kept climbing. MQL volume had dropped 32% quarter over quarter.
We ran three plays this quarter on the account. The bid strategy change was the one that carried most of the recovery.
The Audience Expanded From Country to Region
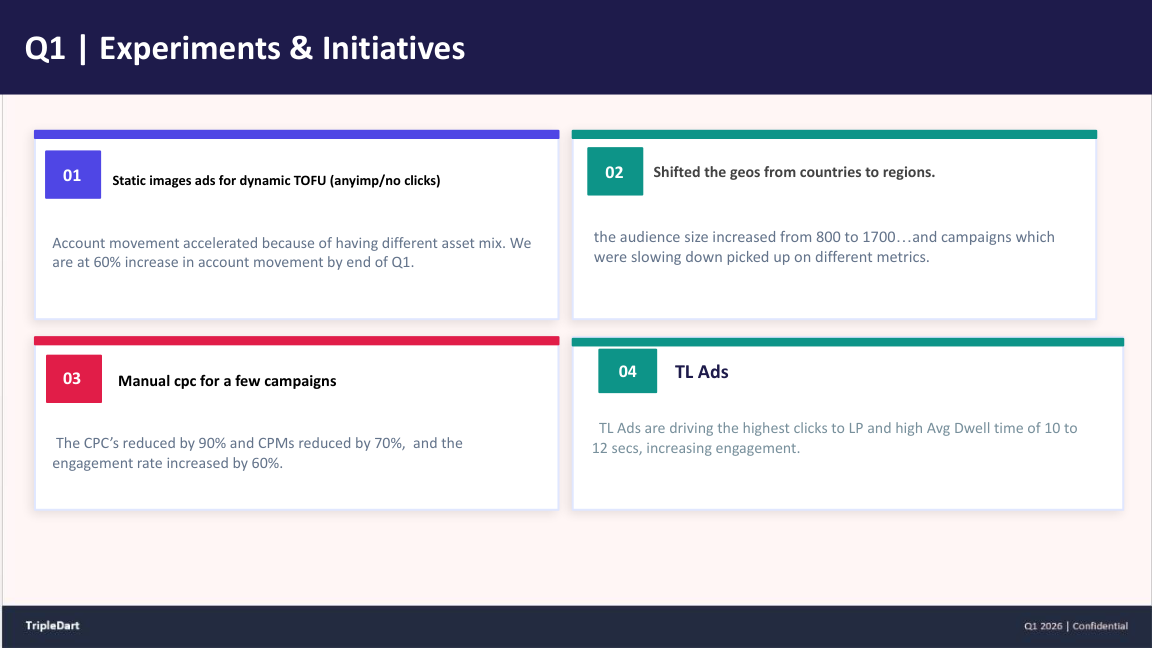
We moved targeting from country-scoped (US, UK, Germany, Japan) to region-scoped (North America, EMEA, APAC). The combined addressable audience grew from 800 to 1,700 accounts. Same campaign structure, same creative, wider pool.
Manual CPC Replaced Automated Delivery
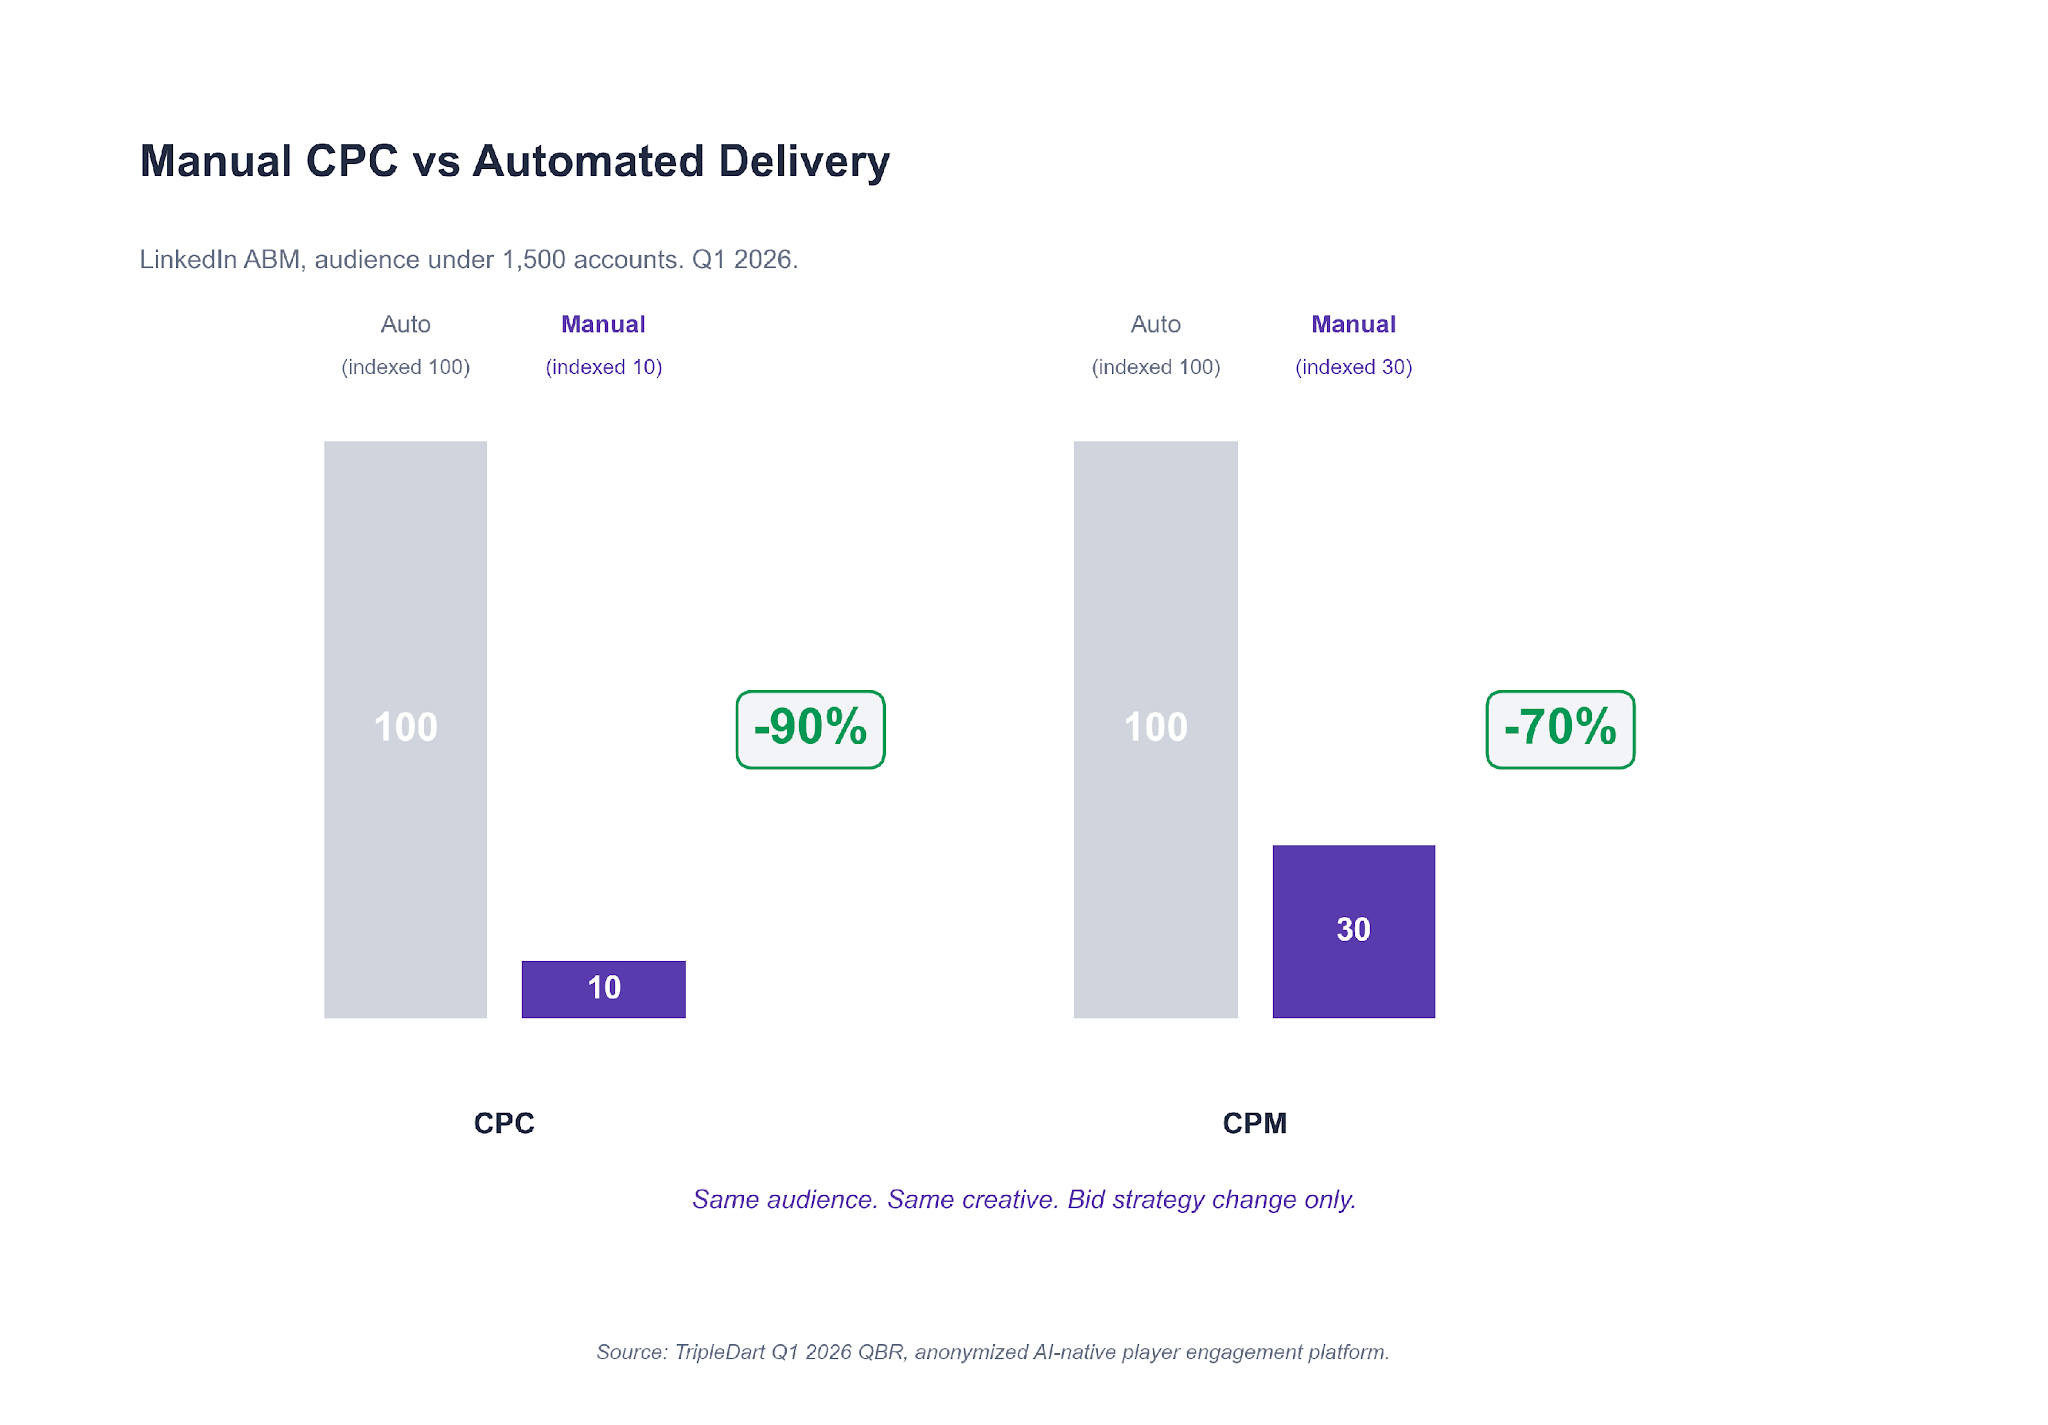
For campaigns still below 1,500 accounts, we moved the bid strategy from Maximum Delivery to Manual CPC. The automated bidder had been overspending on impressions without enough click signal to train on. Manual CPC let us set the price ourselves.
On the specific campaigns we moved, CPCs dropped 90% and CPMs dropped 70% over the following two months. MOFU account movement reached 60% in the same window. LinkedIn advertising cost benchmarks break down how the numbers move by audience scale and campaign type.
Thought Leader Ads Became the BOFU Closer
We ran a C-suite Thought Leader Ads test against the tightest 500 accounts. Average dwell time: 10 to 12 seconds, the highest in the account by a clear margin. Clicks-to-LP beat every other creative format. TL Ads stopped being a test and became the default BOFU format by mid-quarter.
A failure on the same account is worth naming. Before we audited the setup, the client had been running AI-generated video creative on a LinkedIn TOFU campaign. The hypothesis had been that Gen-AI video would let the team refresh creative weekly without the cost of a human edit.
The campaign had hit 10 to 12x frequency in four weeks with zero LP clicks. The audience pattern-matched the same video as low-quality and clickthrough collapsed. We paused it, ran the post-mortem, and added a rule to our LinkedIn ads for SaaS playbook against single-asset Gen-AI video on TOFU audiences.
The LinkedIn Audience-Size Rule We Wrote Mid-Quarter
Under 1,500 accounts: manual control beats the automated bidder. 1,500 to 50,000: hybrid, test both. Over 300,000: trust automation. Starve the bidder of both audience scale and price control, and it cannot converge.
What this means for your account
Pull your LinkedIn audience sizes. For every campaign sitting under 1,500 members, switch to Manual CPC this week. Do not wait for a quarterly review. For campaigns over 300,000, leave automation in place. For anything in between, run a two-week A/B between manual and automated before committing.
Revisit the decision whenever an audience crosses a threshold. If a sub-1,500 audience grows into the 1,500 to 50,000 band, that is the right moment to re-test automated delivery. Growth might come from ABM or sales adding accounts, or from a country-to-region expansion.
Algorithms that could not converge on 800 accounts will often converge cleanly on 1,700. The rule is conditional on audience size, not permanent.
Lesson 5: AI Max Is a Test Regime, Not a One-Shot Decision
Most accounts we audit treat AI Max like a binary choice: on or off, for or against. That framing costs accounts a quarter's worth of learnings. AI Max is a set of bid strategies and a match expansion that only work under specific conditions. Running one test and calling it is how most teams find out whether those conditions are present on their account.
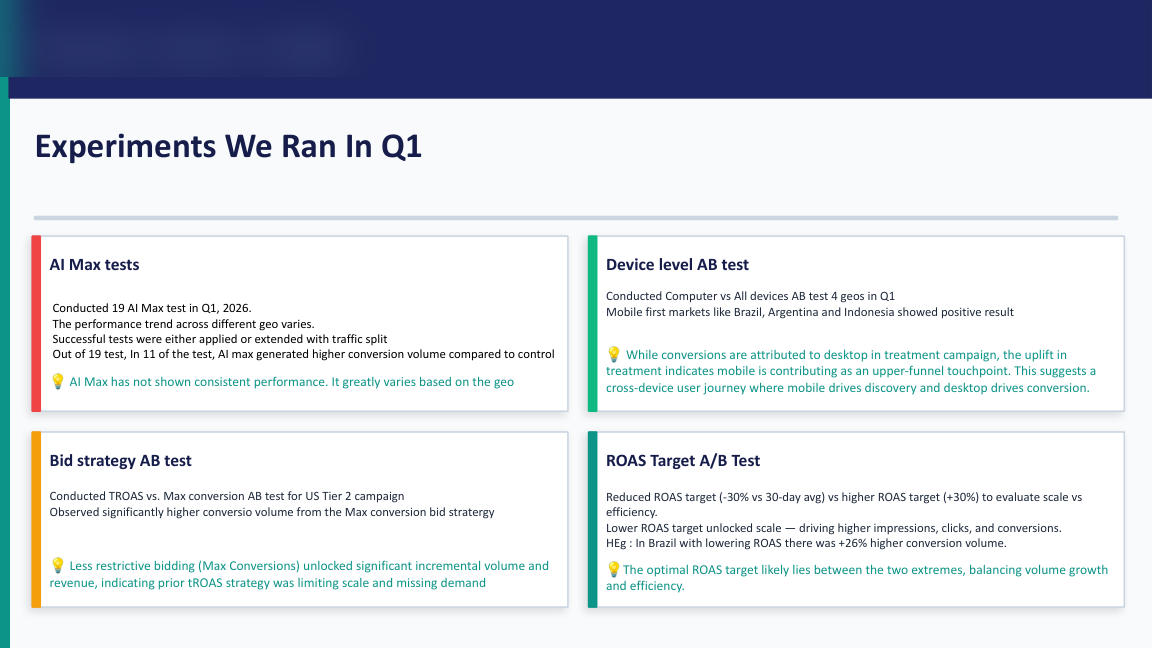
On one self-serve SaaS account, we ran 19 AI Max A/B tests in Q1. AI Max variants beat control in 11 of 19 (a 58% win rate). More useful than the headline rate is the pattern the wins shared.

Loosening the ROAS Target Beat Tightening It
In Brazil, we ran an AI Max variant with the tROAS target dropped 30% below the account baseline. Conversion volume: +26% versus control on the same spend. Across all 11 winning tests, the median tROAS target sat 25% below control.
AI Max variants lost consistently when the tROAS target was at or above the account baseline. The bidder had no room to explore, so it failed to find volume the control could reach.
Competitor Search Carried the Highest ROAS
The UK Competitor Search campaign hit 3.63x ROAS, the highest single-campaign ROAS in the account. Competitor and alt-keyword campaigns beat branded generic on ROAS every week of the quarter. Broad match configured correctly let the campaign pull in adjacent competitor terms the exact-match set would have missed.

Mobile Converted Only in Mobile-First Markets
On the "Computer vs All devices" A/B across 14 campaigns, the Computer-only variant won on CVR in 11 of 14. The three exceptions were Brazil, Argentina, and Indonesia, where mobile-first purchasing is the baseline. Outside those geos, mobile in B2B SaaS is a research touchpoint, not a conversion touchpoint.
The pattern of failures in the other 8 tests was the more instructive half. Losing AI Max tests shared a profile. Strict tROAS targets at or above account baseline. Mid-funnel audiences with thin conversion signal. Or campaigns where the conversion action was sub-scale to begin with. Strip either the ROAS headroom or the training volume, and AI Max underperforms the control.
What this means for your account
Do not run one AI Max test and call it. Build a rolling monthly A/B program. In the first month, run three AI Max variants, each with a tROAS target 20% to 30% below your baseline. If a variant wins, promote it. If one loses, retire it. After three months, you will have a lived read on where AI Max works on your account and where it does not. That is worth more than any single-test yes-or-no call.
One practical note on running the test regime. Keep the control campaign on whatever bid strategy it was already using (Max Conversions, Target ROAS, or Target CPA). Do not change the control while the test is live. If you do, you will not be able to separate the AI Max effect from the strategy effect.
Keep the variant and control running in parallel for at least four weeks per test. Read results against a clean four-week baseline, not a calendar month that happens to overlap with seasonal spend changes.
Lesson 6: Your PMax Report Is Probably Lying About Brand
Most Performance Max reports we audit tell a flattering story. High signup volume, low CPA, strong ROAS. The problem is that most of those reports do not survive a look at the search-terms view.
On a PLG-led email and marketing SaaS account, PMax was the best-performing campaign on signups and paid upgrades. It was also the campaign we were most nervous about. PMax's historical black-box matching meant we could not see what queries it was winning. When we pulled the search-terms view from PMax's newer transparency features, the pattern was unambiguous.
PMax was absorbing brand traffic and taking credit for it.
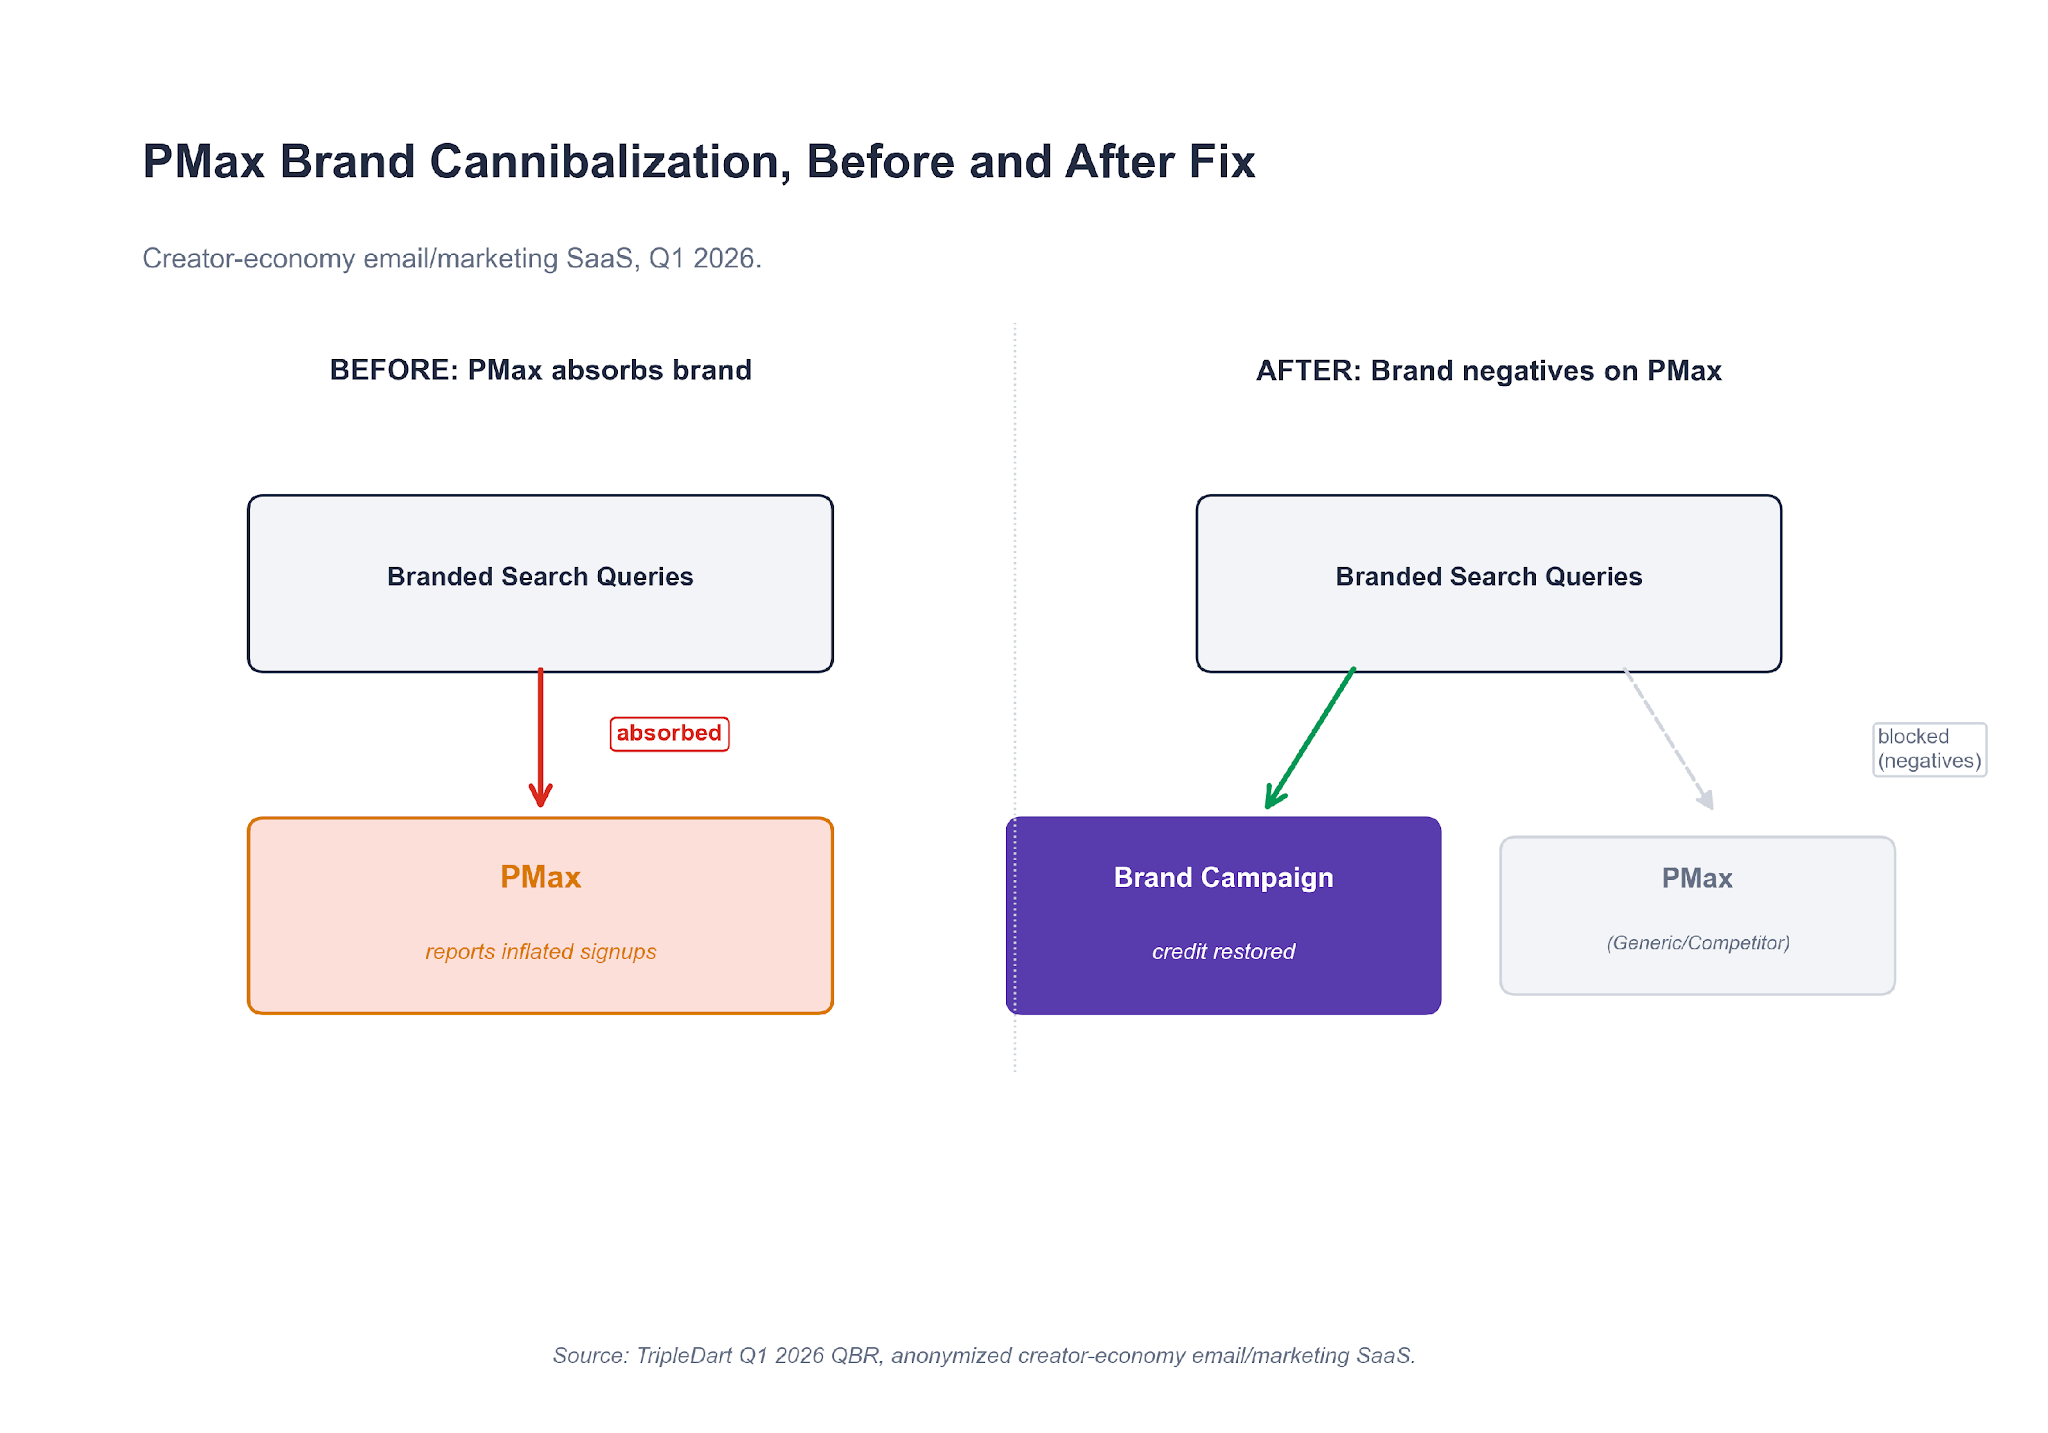
The top converting PMax search queries were the company's brand name, variants of the brand name, and a top competitor's brand name. The last is a competitor term that had historically lived in a separate Competitor campaign.
PMax was running the branded queries in parallel with the Brand campaign at a lower CPC. It was winning the click and attributing the signup to itself. The dashboard view read as top-of-funnel demand. The search-terms view read as a Brand campaign misclassified as PMax.
The fix was structural, not tactical.
Step 1. Brand Terms as Negatives on Every PMax Asset Group
Every brand term went onto PMax as a negative. That took PMax out of the branded auction entirely and forced the Brand campaign budget to do its own work.
Step 2. PMax Split Into Competitor and Generic
Competitor targeting went into its own asset group with competitor-only audience signals. Generic targeting got a cleaner audience lineup without competitor overlap. Two campaigns, two audience shapes, two sets of creative.
Step 3. Switch-Now Competitor Creative
The angle was direct: "#1 Alternative," "Free Plan Too Basic?," "Time to Switch." Aggressive for a PLG brand, but the audience was already searching with switch intent.
The numbers shifted within three weeks.
- Branded signups previously attributed to PMax reverted to the Brand campaign.
- Bing Search, which we had historically treated as a cheap-volume backstop, settled at $200 to $300 CPL against $600 to $800 CPL on Google generic. The CPL gap was always there. It only became visible once PMax stopped absorbing branded queries.
- PMax's absolute numbers dropped. Signup-to-upgrade rate and retention-at-30-days improved.
The PMax Rule We Added This Quarter
Every PMax campaign we launch on a branded SaaS account now starts with the full brand-term negative list pre-loaded. PMax's defaults will cannibalize brand search until told otherwise. Skip this step and your PMax report will look great for reasons that have nothing to do with genuine new demand.
What this means for your account
Open PMax's search-terms view this week. If your brand name or variants show up in the top ten converting queries, your PMax campaign is cannibalizing. Add every brand term as a negative, then re-read your Brand campaign's weekly numbers. The pipeline you thought had disappeared will probably show up in the right place.
Our Google Ads strategy playbook for PMax now starts with the negative list, not the asset feed. Google Ads brand exclusions documentation covers the mechanics if you need the walkthrough.
Two second-order patterns worth checking once the cannibalization is out. First, paid-channel CPL often drops on channels that were being compared unfairly against an inflated PMax benchmark (Bing is the usual beneficiary). Second, quality metrics on PMax itself tend to improve: signup-to-upgrade rate, time-to-first-use, retention-at-30. The signups you lose were the low-quality half of the mix. The ones that remain are higher-intent, and the retention curves start to look honest.
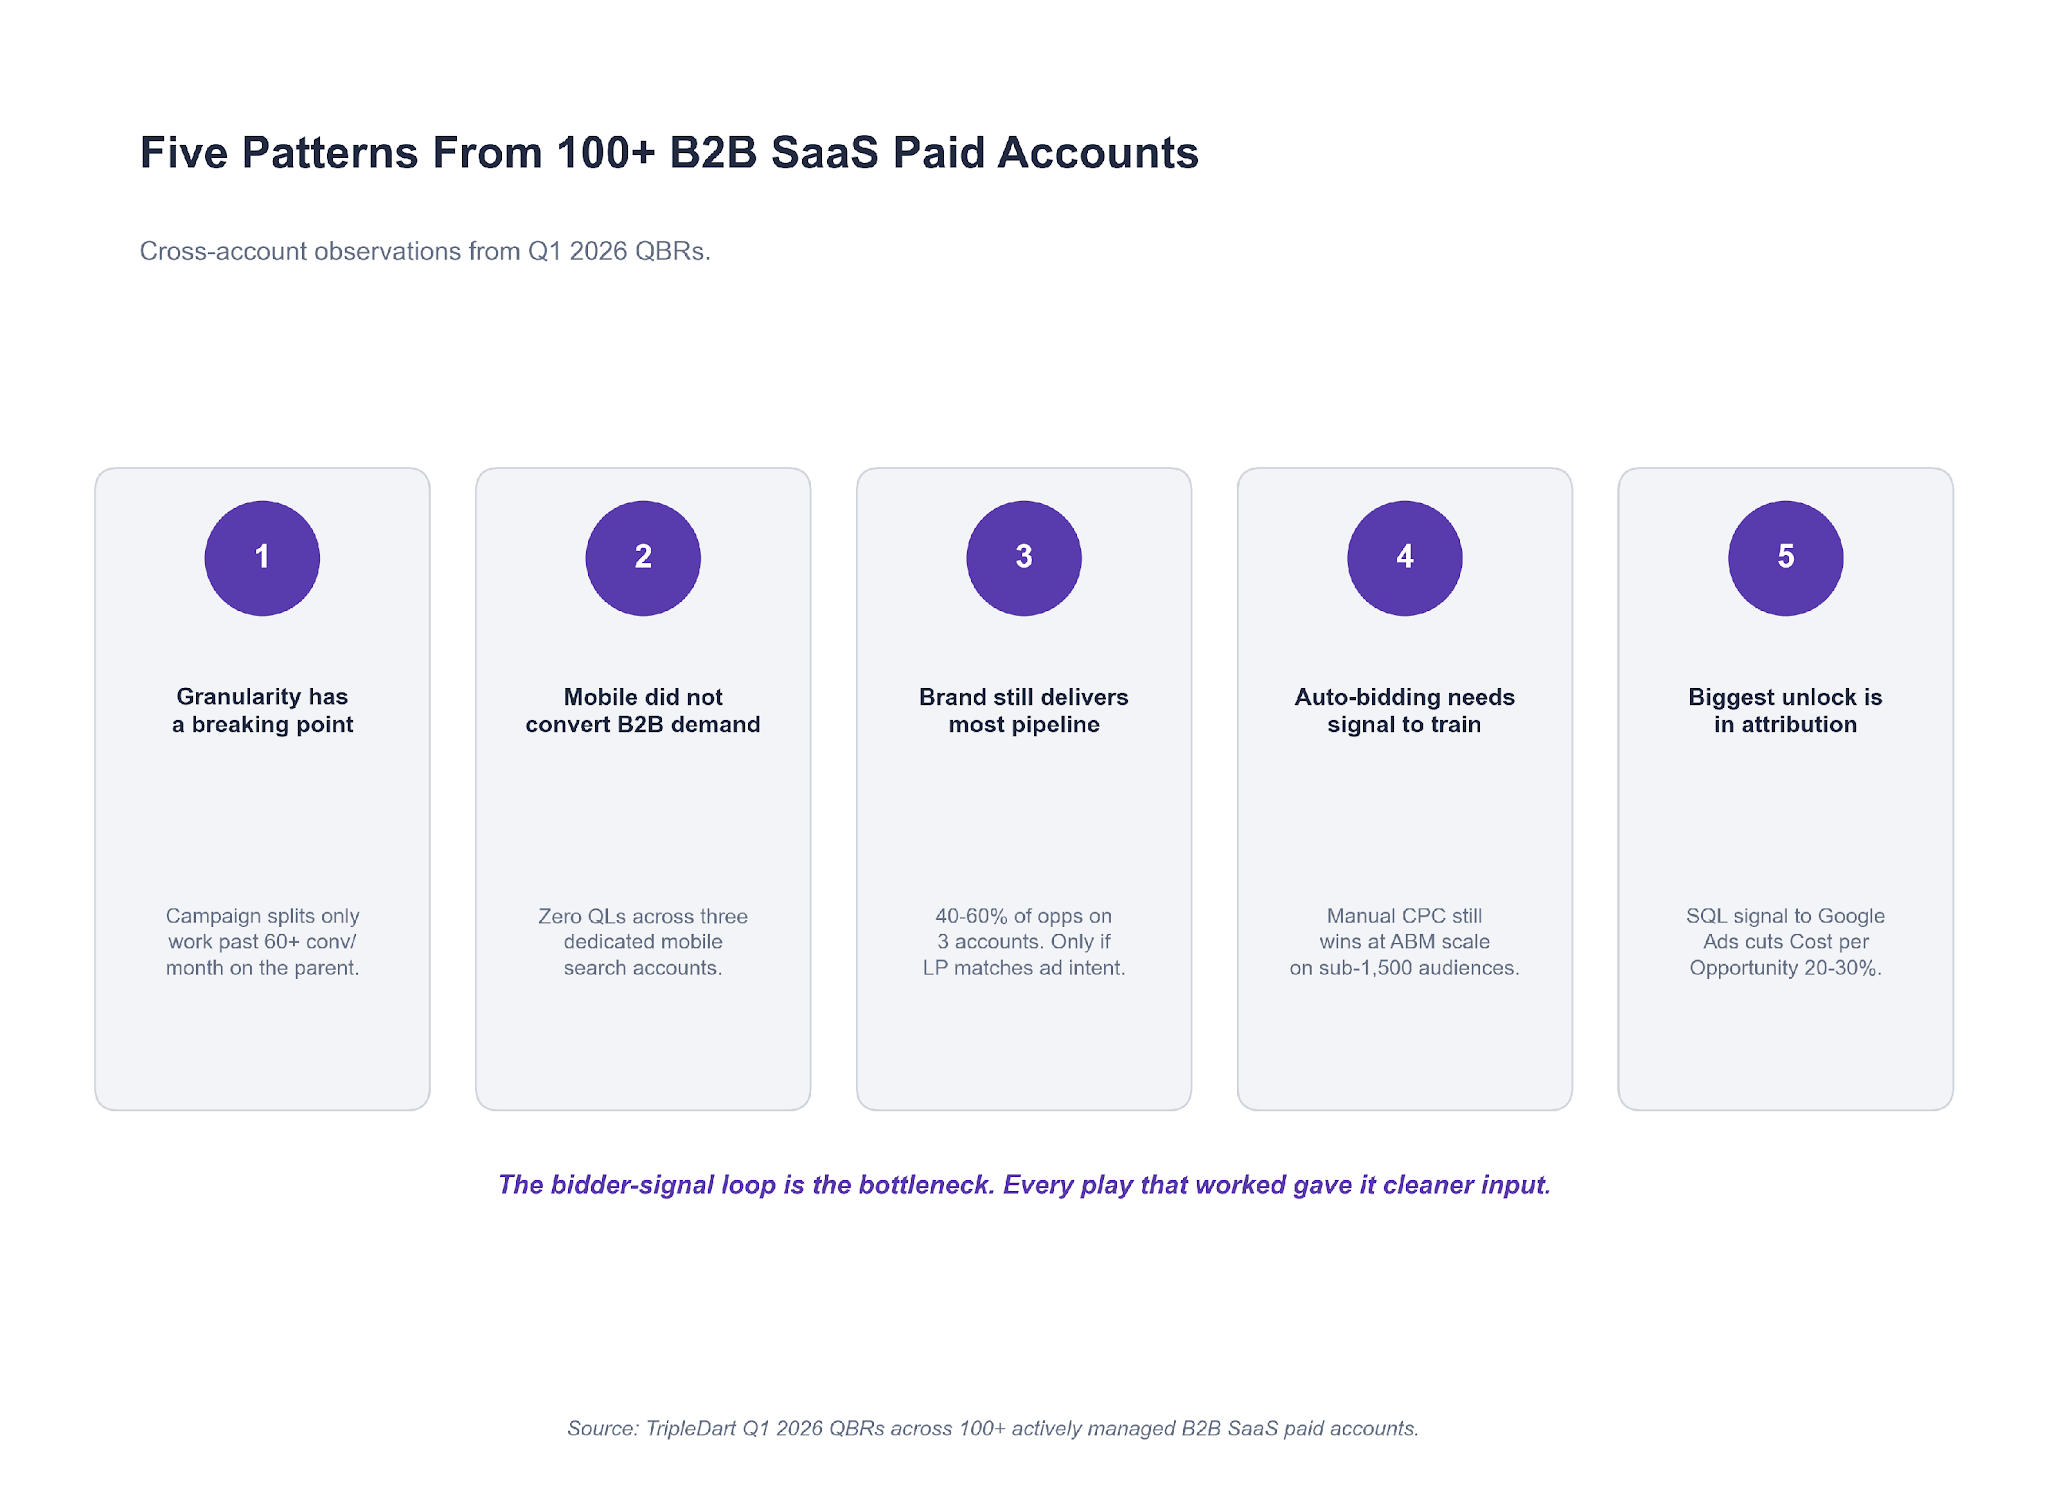
Five Checks to Run On Your Own Account This Quarter
The six lessons above came from six different accounts. When we aggregate across the wider portfolio, the same five checks show up in almost every quarterly review. Run these on your own account before the quarter ends.
Check 1. Count conversions before you split anything
Pull the last 30 days of conversions on your largest Search campaign. If it is under 60, do not split. If it is over 60, map out whether an intent split would give each child 30+ conversions a month. The split decision is math, not intuition.
Check 2. Audit your mobile campaign structure
If you are running dedicated mobile search campaigns outside Brazil, Argentina, or Indonesia, they are probably producing zero qualified leads. We saw this pattern on three separate accounts this quarter. Move mobile to a device bid adjustment inside desktop-first campaigns and reclaim the budget.
Check 3. Check where your Brand campaign traffic is landing
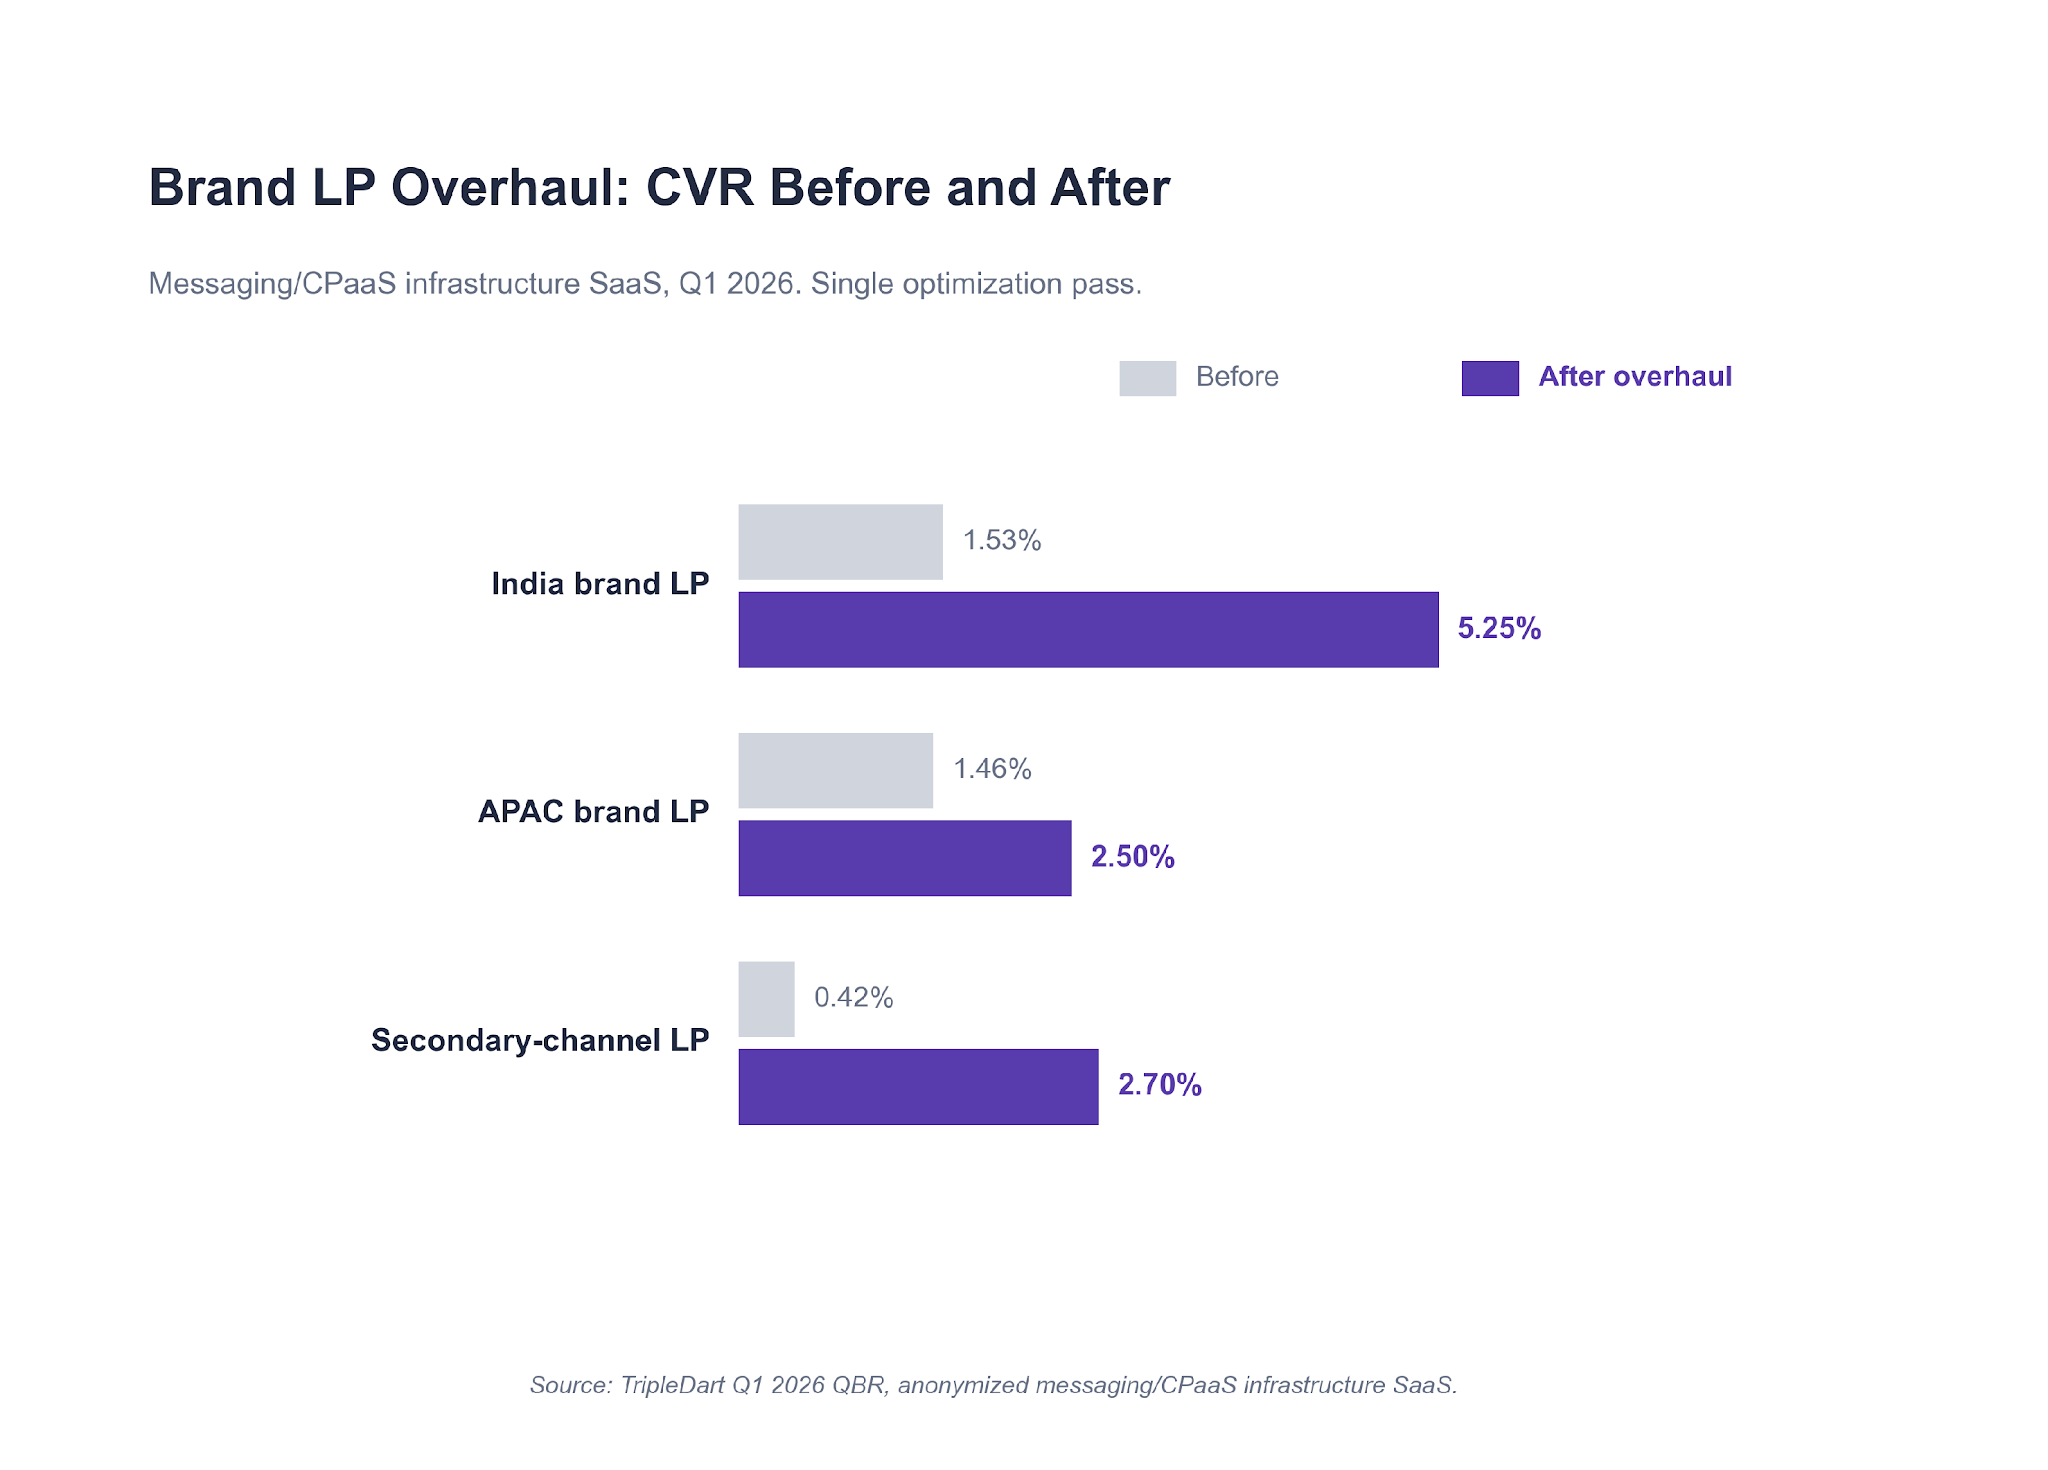
On three of the six accounts in this report, brand search drove 40% to 60% of directly-attributed opportunities. The CVR lift on the CPaaS account came entirely from a dedicated landing page, not more spend. If your Brand campaign is routing traffic to a generic homepage, you are losing the cheapest, highest-intent clicks in the account. HubSpot B2B research on intent-matched landing pages reads consistent with what we see week after week.
Check 4. Find the Bid Strategies That Are Starving
Pull every campaign on Target CPA. For each one, check whether it delivered at least 30 conversions last month. If not, move it to Max Conversions with a soft ROAS guardrail. Do the same on LinkedIn: any campaign on Maximum Delivery with an audience under 1,500 accounts should be on Manual CPC by end of week. Our best SaaS PPC agencies roundup compares how different agencies handle bid-strategy decisions at different account sizes.
Check 5. Check the Attribution Layer Before You Change the Ad Layer
On one account in this report, the highest-impact Q2 play is a HubSpot lifecycle fix. Sending SQL signal back into Google Ads as an offline conversion import is projected to reduce Cost per Opportunity by 20% to 30%. That is larger than any tactical change the team identified.
The plumbing layer (CRM lifecycle, offline conversions, closed-loop routing) is where most of the highest-impact SaaS PPC work sits. It rarely shows up on the paid dashboards, which is part of why it gets underinvested in.
One quick test you can run this week. Pull the last 90 days of paid-associated opportunities from your CRM. Cross-reference them against the conversion actions firing in Google Ads. If the two lists do not match inside a 10% variance, your bidder is optimizing toward the wrong thing. The fix is instrumentation, not creative. And the gap tends to be worst on accounts that recently migrated attribution from last-touch to multi-touch without re-wiring the ad platform.
What We're Running in Q2, and When It Applies to You
Five bets are live across the portfolio entering Q2. Each one only makes sense under specific conditions on your account. Apply them as conditional plays, not a checklist.
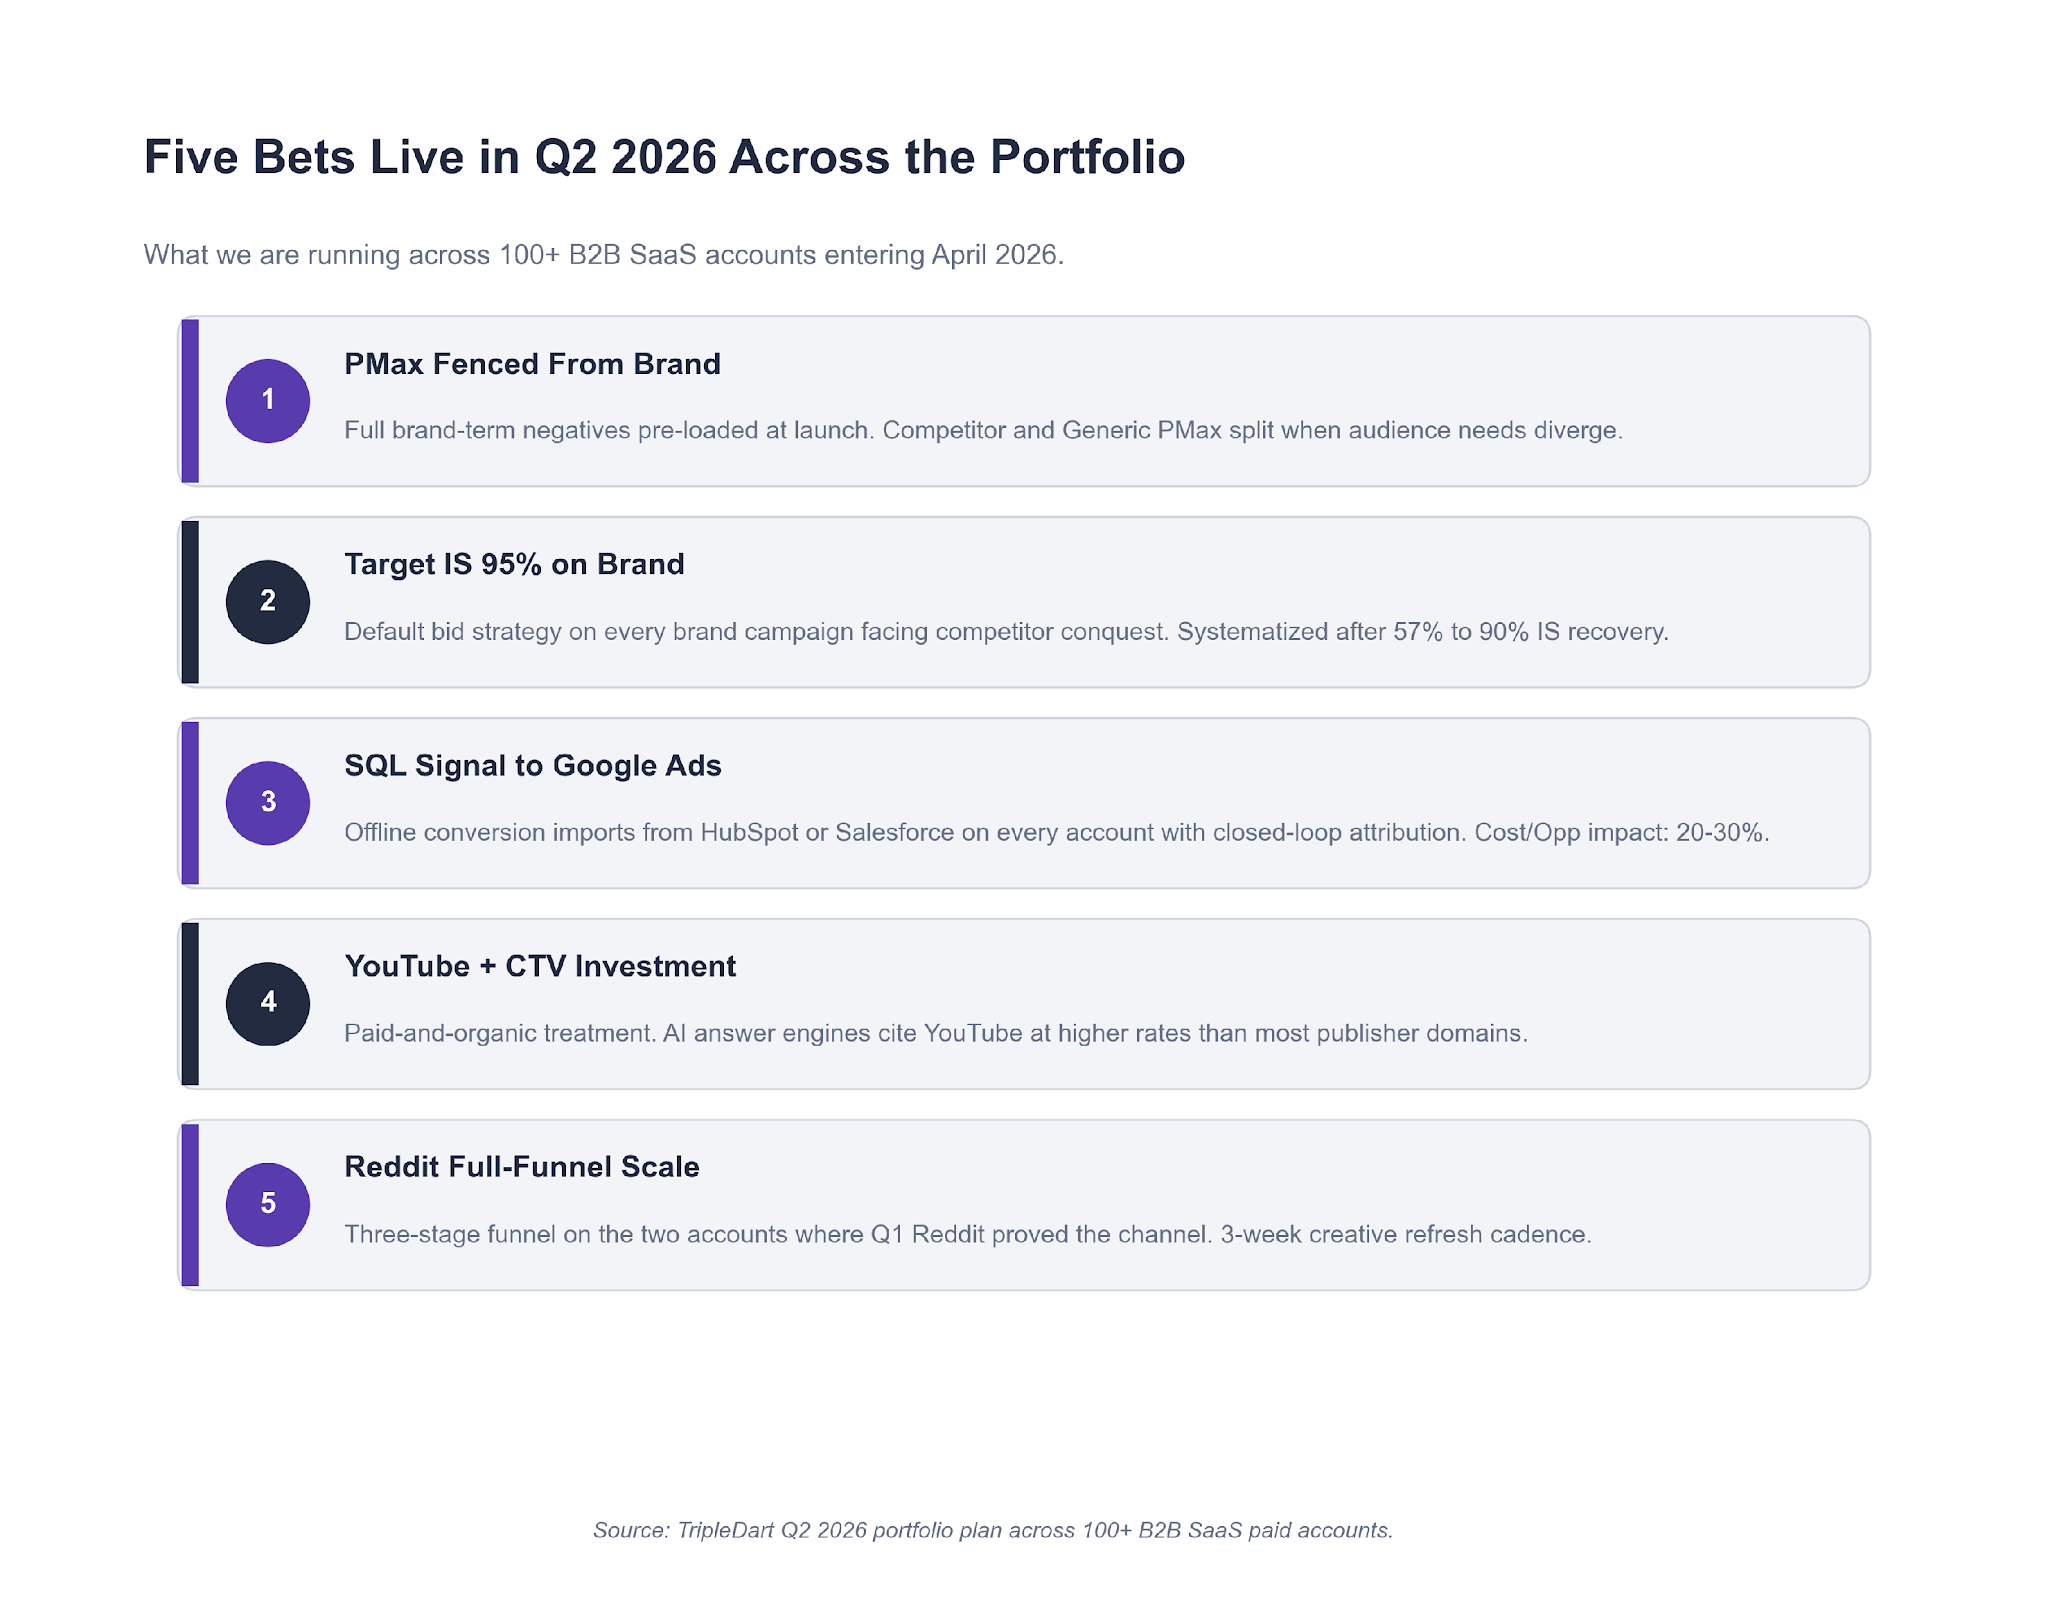
Fence PMax from brand
Apply if you run PMax on a branded SaaS account and have not pre-loaded brand-term negatives. Full negative keyword list at launch. Split PMax-Competitor and PMax-Generic when audience needs diverge.
Target Impression Share on brand
Apply if a competitor is actively bidding on your brand terms. Move Brand to Target Impression Share at 90% to 95%. Do not scale-test, just switch.
Offline conversion imports on every closed-loop account
Apply if your CRM lifecycle (HubSpot or Salesforce) has clean SQL and Opportunity stages. Optimizing toward pipeline beats optimizing toward form submits, full stop.
YouTube and CTV investment on two accounts
Apply if your account already has organic content momentum and needs credibility at the top of funnel. AI answer engines cite YouTube at a higher rate than most publisher domains. The AI and PPC intersection is where this sits in our wider playbook.
Reddit full-funnel on the two accounts where Q1 proved the channel
Apply only if you can commit three funnel stages (awareness, mid-funnel, BOFU retarget) with a three-week creative refresh. Skip otherwise.
Two watchlist items that did not make the bet list:
- AI-agent referral traffic (ChatGPT, Perplexity, Gemini) is growing fast but sub-scale to spend against today. We are instrumenting it in Q2 with dedicated UTMs and landing page variants. HubSpot's AI marketing research tracks the same trend at industry level.
- Dedicated mobile search lead-gen campaigns are officially off the portfolio. Zero QLs across three accounts over a full quarter is a strong enough signal to kill the campaign type outside mobile-first markets.
The Templates We Ran This Quarter
A few readers have asked for the internal documents and sheets behind the six stories above. Five templates carry the bulk of the paid media engagement. None of these are novel on their own. What matters is the rule set built into each one, which is what keeps outputs consistent across 100+ managed accounts.
Template 1. QBR Performance Summary Slide
One slide, full quarter. Four KPI tiles, a three-point monthly trend chart, and a four-sentence commentary block. The image below shows both the slide layout and the rule set that decides what goes on it.
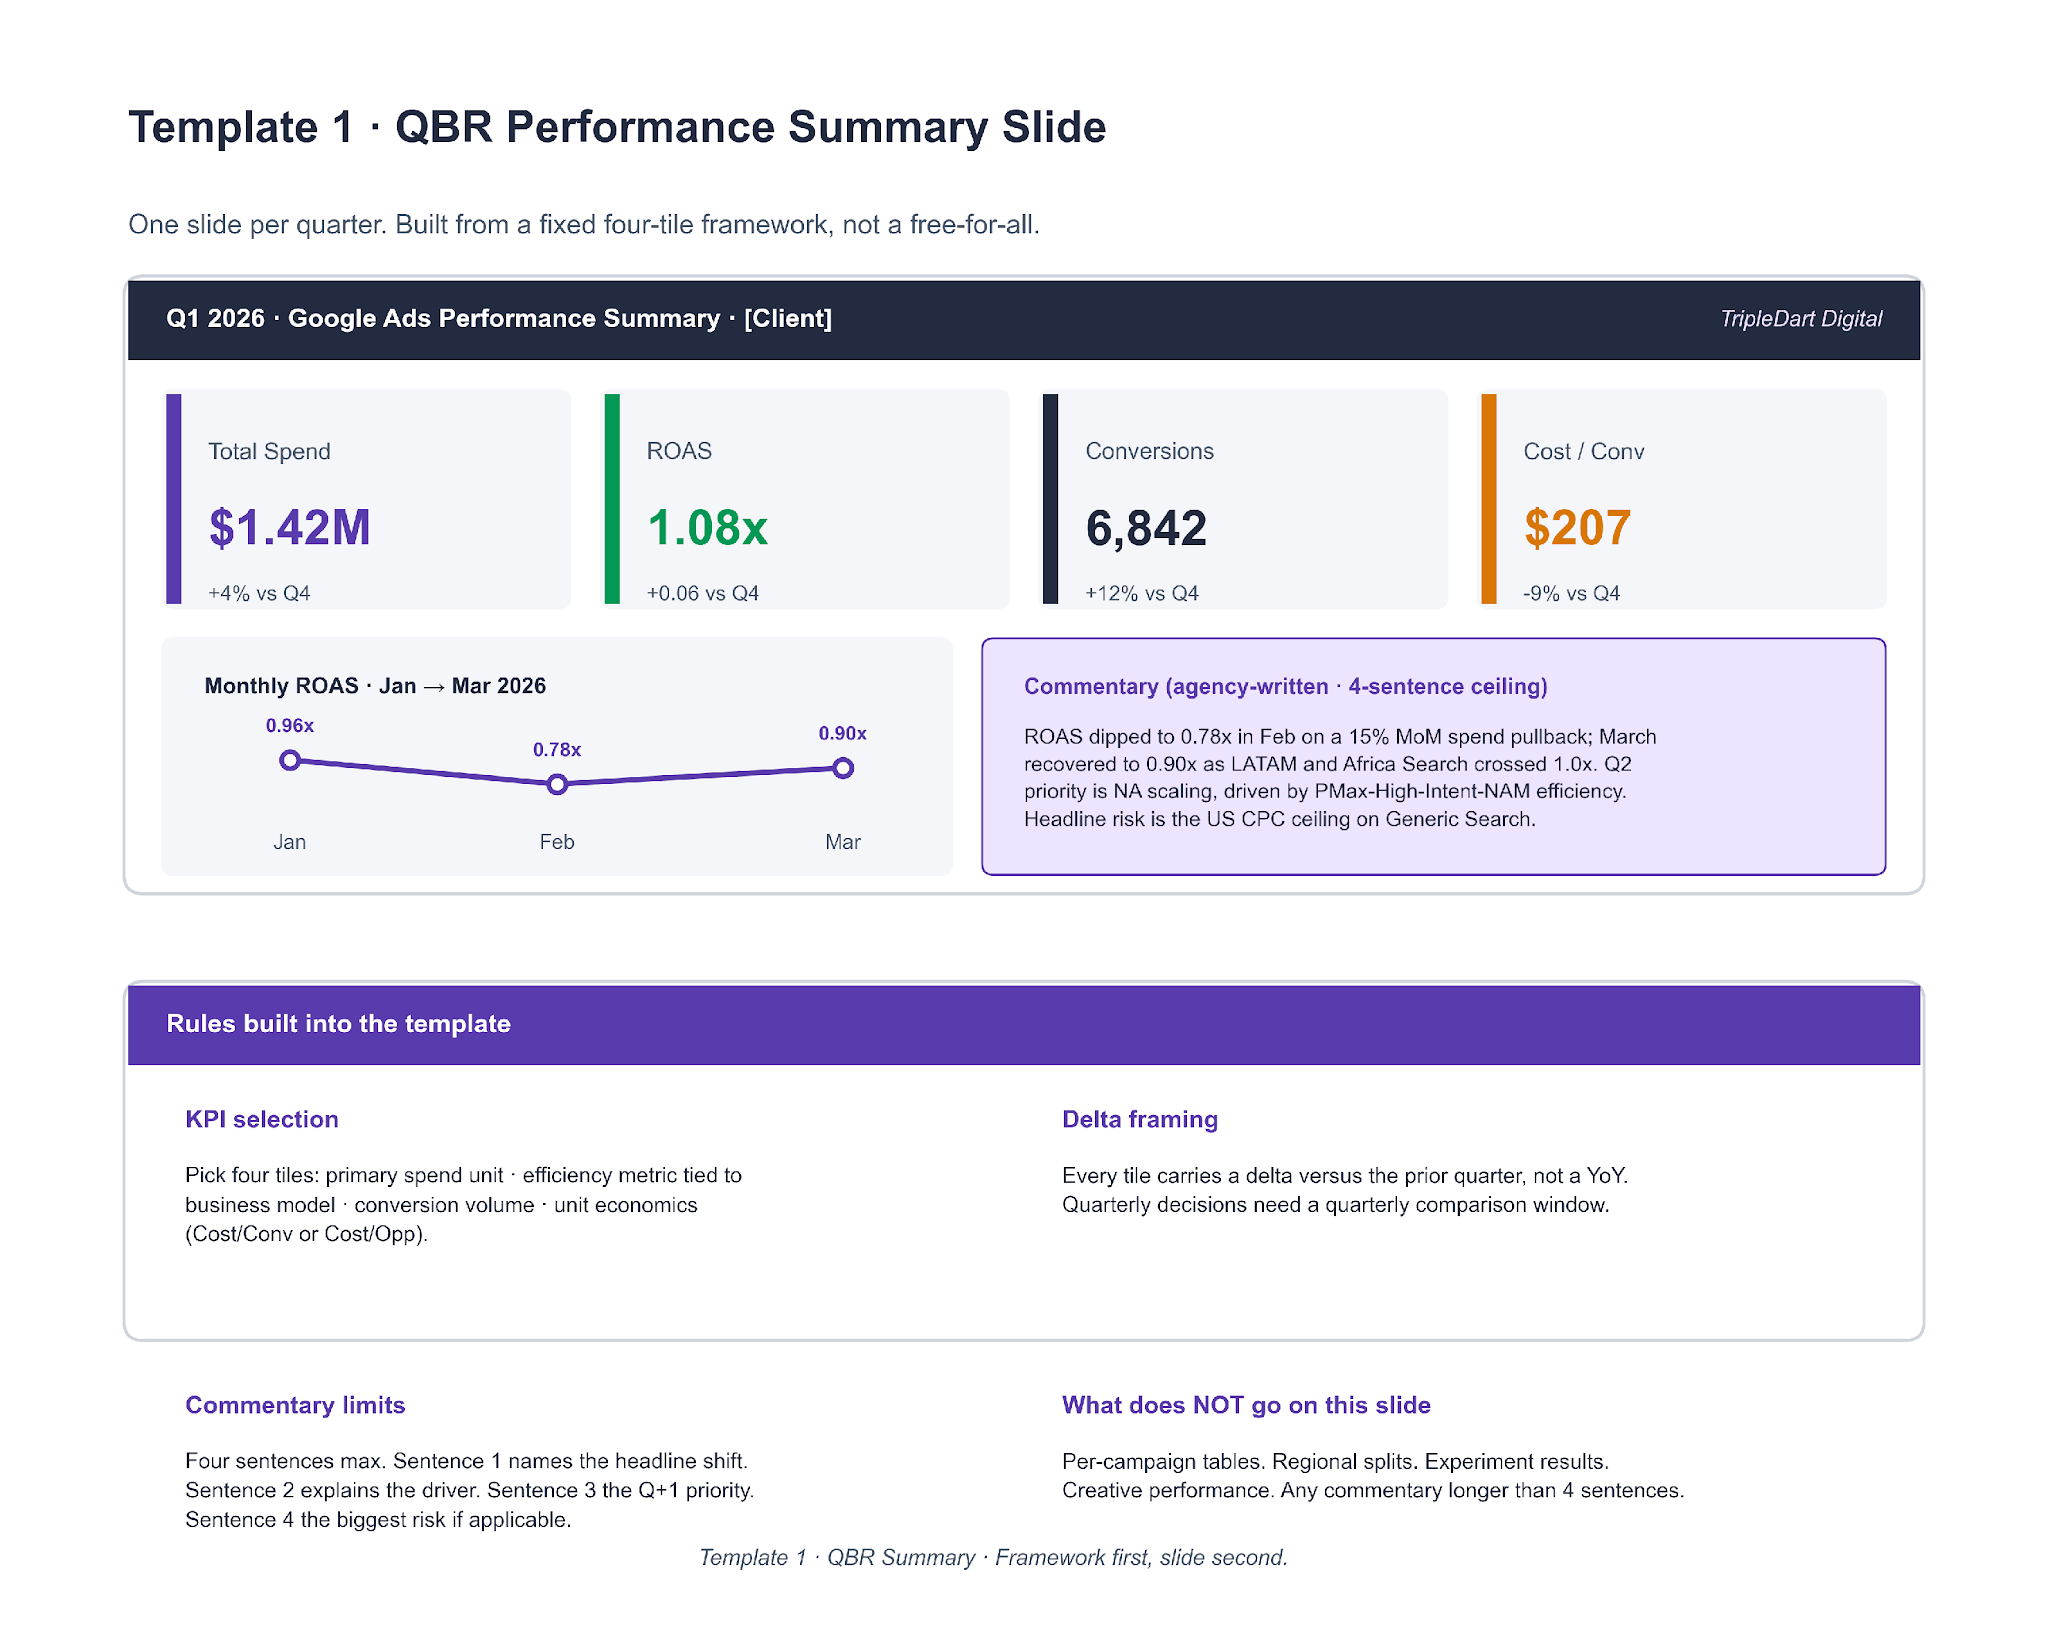
The rules matter more than the layout. Most in-house decks fail at KPI selection (too many metrics, no hierarchy) or at commentary (a paragraph where a sentence belongs). Pick four tiles in a fixed priority order: primary spend unit, efficiency metric tied to the business model, conversion volume, unit economics. Everything longer than four sentences of commentary lives on deeper slides.
Template 2. Q Experiment Log
Every A/B test we run in a quarter is logged as a row. The top of the template defines what each column has to carry. The bottom defines the verdict logic, declared before the test runs, not after.

The verdict logic is the load-bearing part. "Win" is defined: primary metric moved in the predicted direction by more than 15% over four weeks at spend at least 3x control median CPA. "Loss" is defined. "Inconclusive" is defined. Declaring the thresholds upfront removes the post-hoc argument about whether a test worked. The Q1 "AI Max beat control in 11 of 19" line came straight off the sheet, not a separate analysis pass.
Template 3. Campaign Naming Convention
Same six-segment grammar across every client account. Underscores as separators, no spaces, no campaign IDs. The point is that the name becomes a structured record a parser can split.
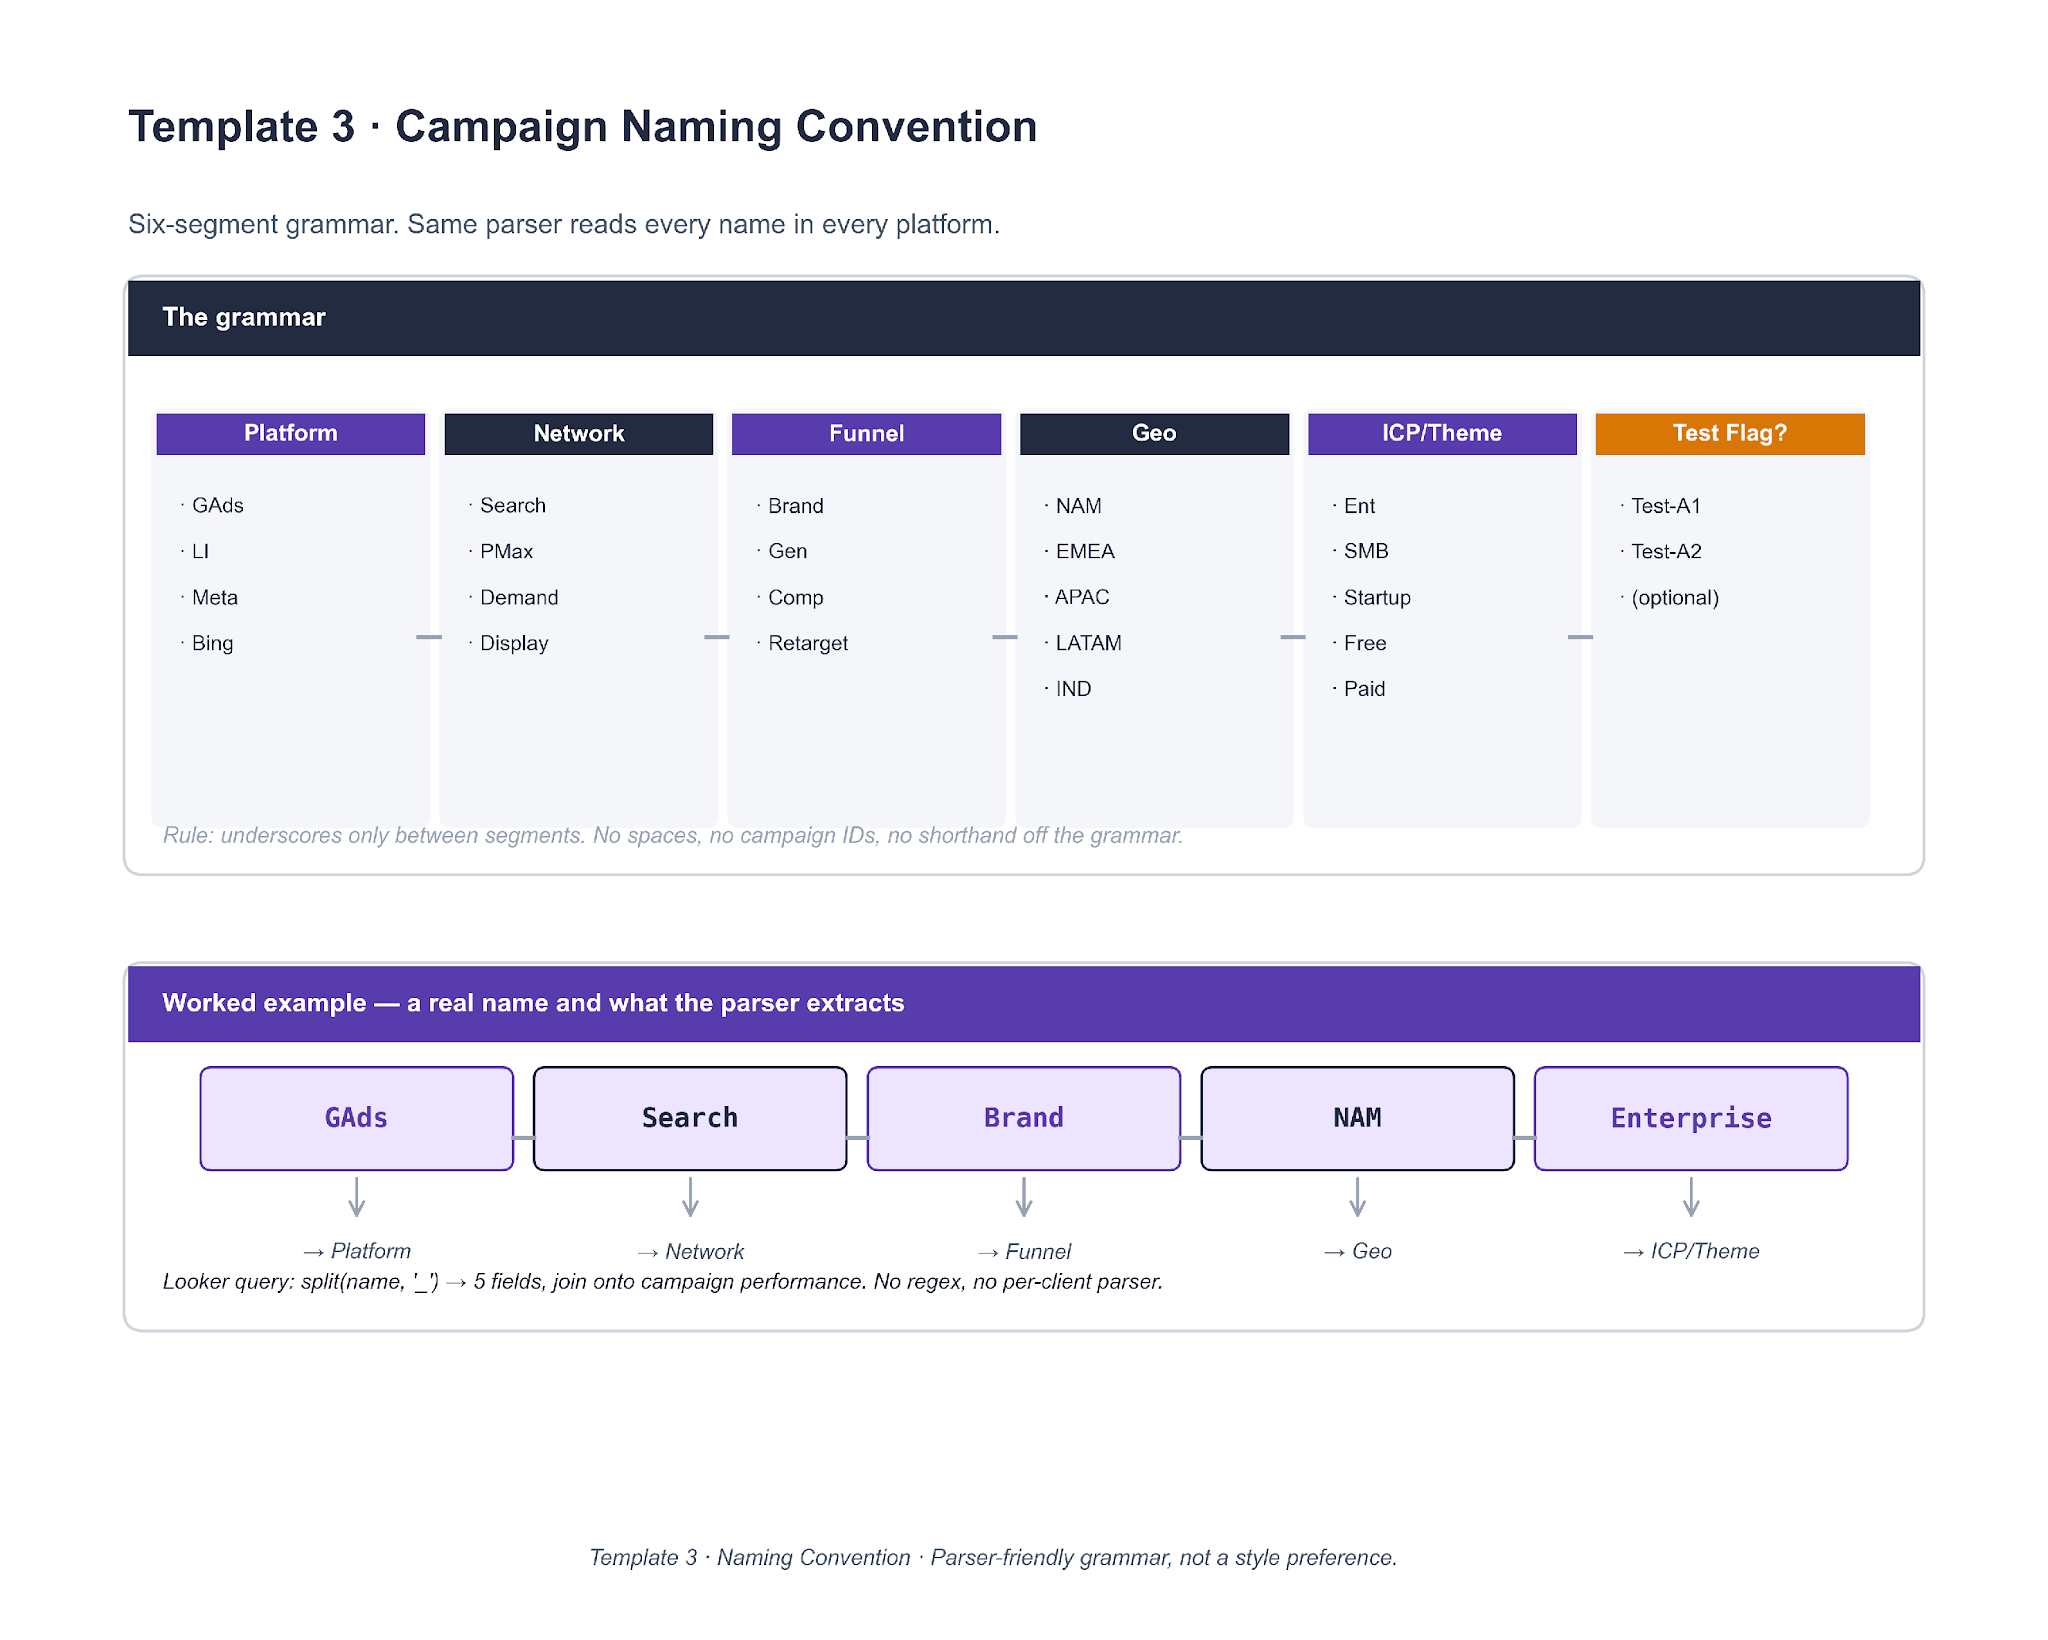
A single Looker query — split(name, '_') into five fields, then join on the campaign performance table — works across every account that follows the grammar. No regex, no per-client parser. Accounts that adopted the grammar in 2023 have meaningfully faster reporting loops than accounts that kept free-text names.
Template 4. Master Negative Keywords List
A shared 800-plus-term list grouped into nine categories, loaded on day one of every new engagement. The top of the image shows the categories. The bottom shows the four-question decision tree that classifies any new junk term.

The classifier is the part worth cloning. Four questions in order: is it a job or career query, is it free / DIY / open source intent, is the intent ambiguous or meta, and is it out of ICP or geo. A no on all four means the term is not a negative and likely belongs on a bid-up list instead. This is also the loop that keeps the master list fresh: anything hit on three or more accounts in the same week gets promoted back to the shared list.
Template 5. Landing Page Brief
One page, eight sections. Each section has a driving question. If the brief cannot answer its own question, the LP should not be built yet.

The driving question is the forcing function. "Who specifically shows up on this page?" forces a concrete ICP, not a persona. "What triggered their Google search, in their own words?" forces a query, not a value prop. "What fires on GA4 and the ad platform?" forces a named event, not "conversion". Most rushed LPs skip sections 3 (ad-LP match promise) and 8 (QA checklist). The first one costs Quality Score. The second one costs 48 hours of post-launch fire-fighting.
If you want the editable working files we use with clients, book a strategy call and we will share them.
The AI Workflows We Ran the Paid Media Work Through
The six lessons in this report did not come out of a manual audit pass. A lot of the diagnostic work ran through a set of agency AI workflows we have built on top of Claude, each one tuned for a specific paid-media task. Each workflow below is drawn as a real flow — inputs, logic, outputs — so the structure is clonable, not just the output. Running these on a weekly cadence rather than quarterly is how findings like the Lesson 2 Brand Impression Share leak or the Lesson 6 PMax brand absorption surfaced in days rather than months.
Workflow 1. Google Ads Audit
A Google Ads CSV export feeds into a parser, then into five rule engines running in parallel — 56 total rules across wasted spend, Impression Share, Quality Score, bid strategy, and attribution. Findings are scored on severity = impact × ease-of-fix and clustered before the final ranked report.
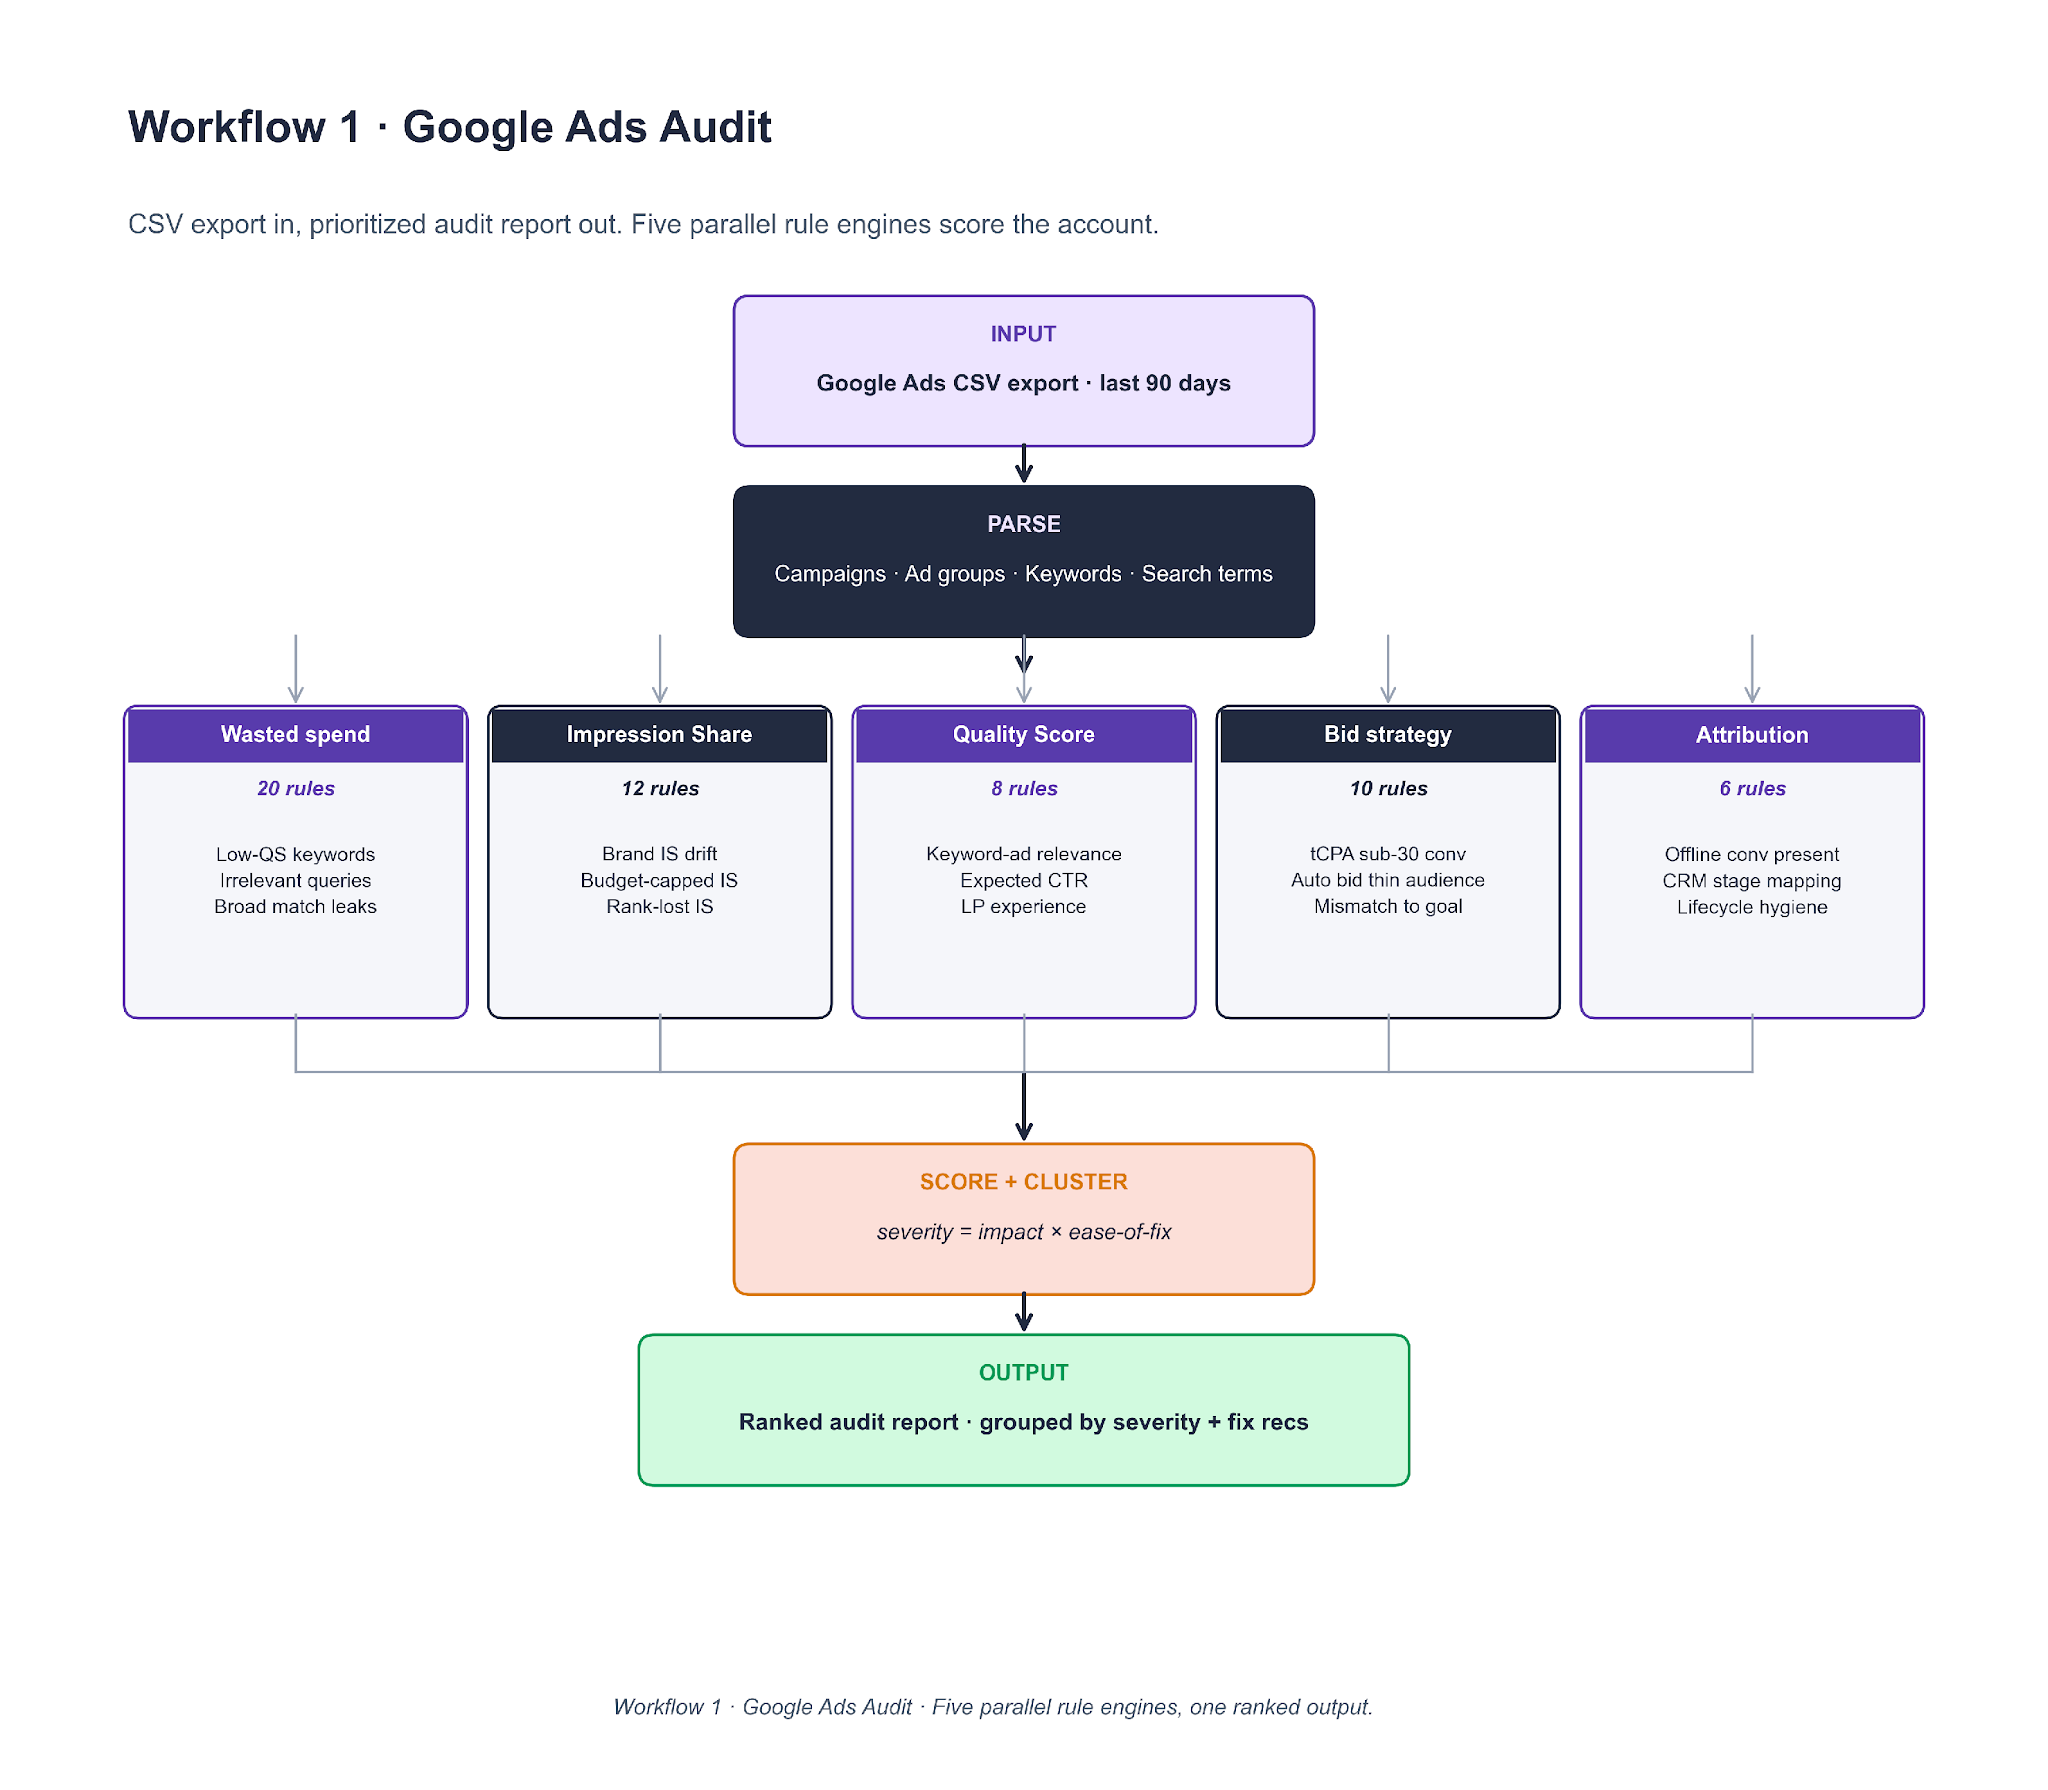
To clone it, the core piece is the rule file. Each rule is a short YAML entry with a predicate (evaluated on a campaign, ad group, keyword, or search-term row) and a severity weight. Claude runs the rule set against the parsed data and returns (finding, severity, spend-at-risk) tuples. Cluster by keyword overlap, sort by severity × spend-at-risk, and run the workflow monthly on every managed account as a scheduled job rather than ad-hoc. Lesson 2's Brand IS finding surfaced here a week before it showed up on the client dashboard.
Workflow 2. PPC Negative Keywords
Every search term from the last 14 days runs through a five-stage pipeline: ingest, classify, master-list lookup, spend gate, output. The classifier is a nine-class intent tagger, and each class has a pre-assigned action (ADD exact, ADD phrase, ADD broad, SKIP, or KEEP and bid up).
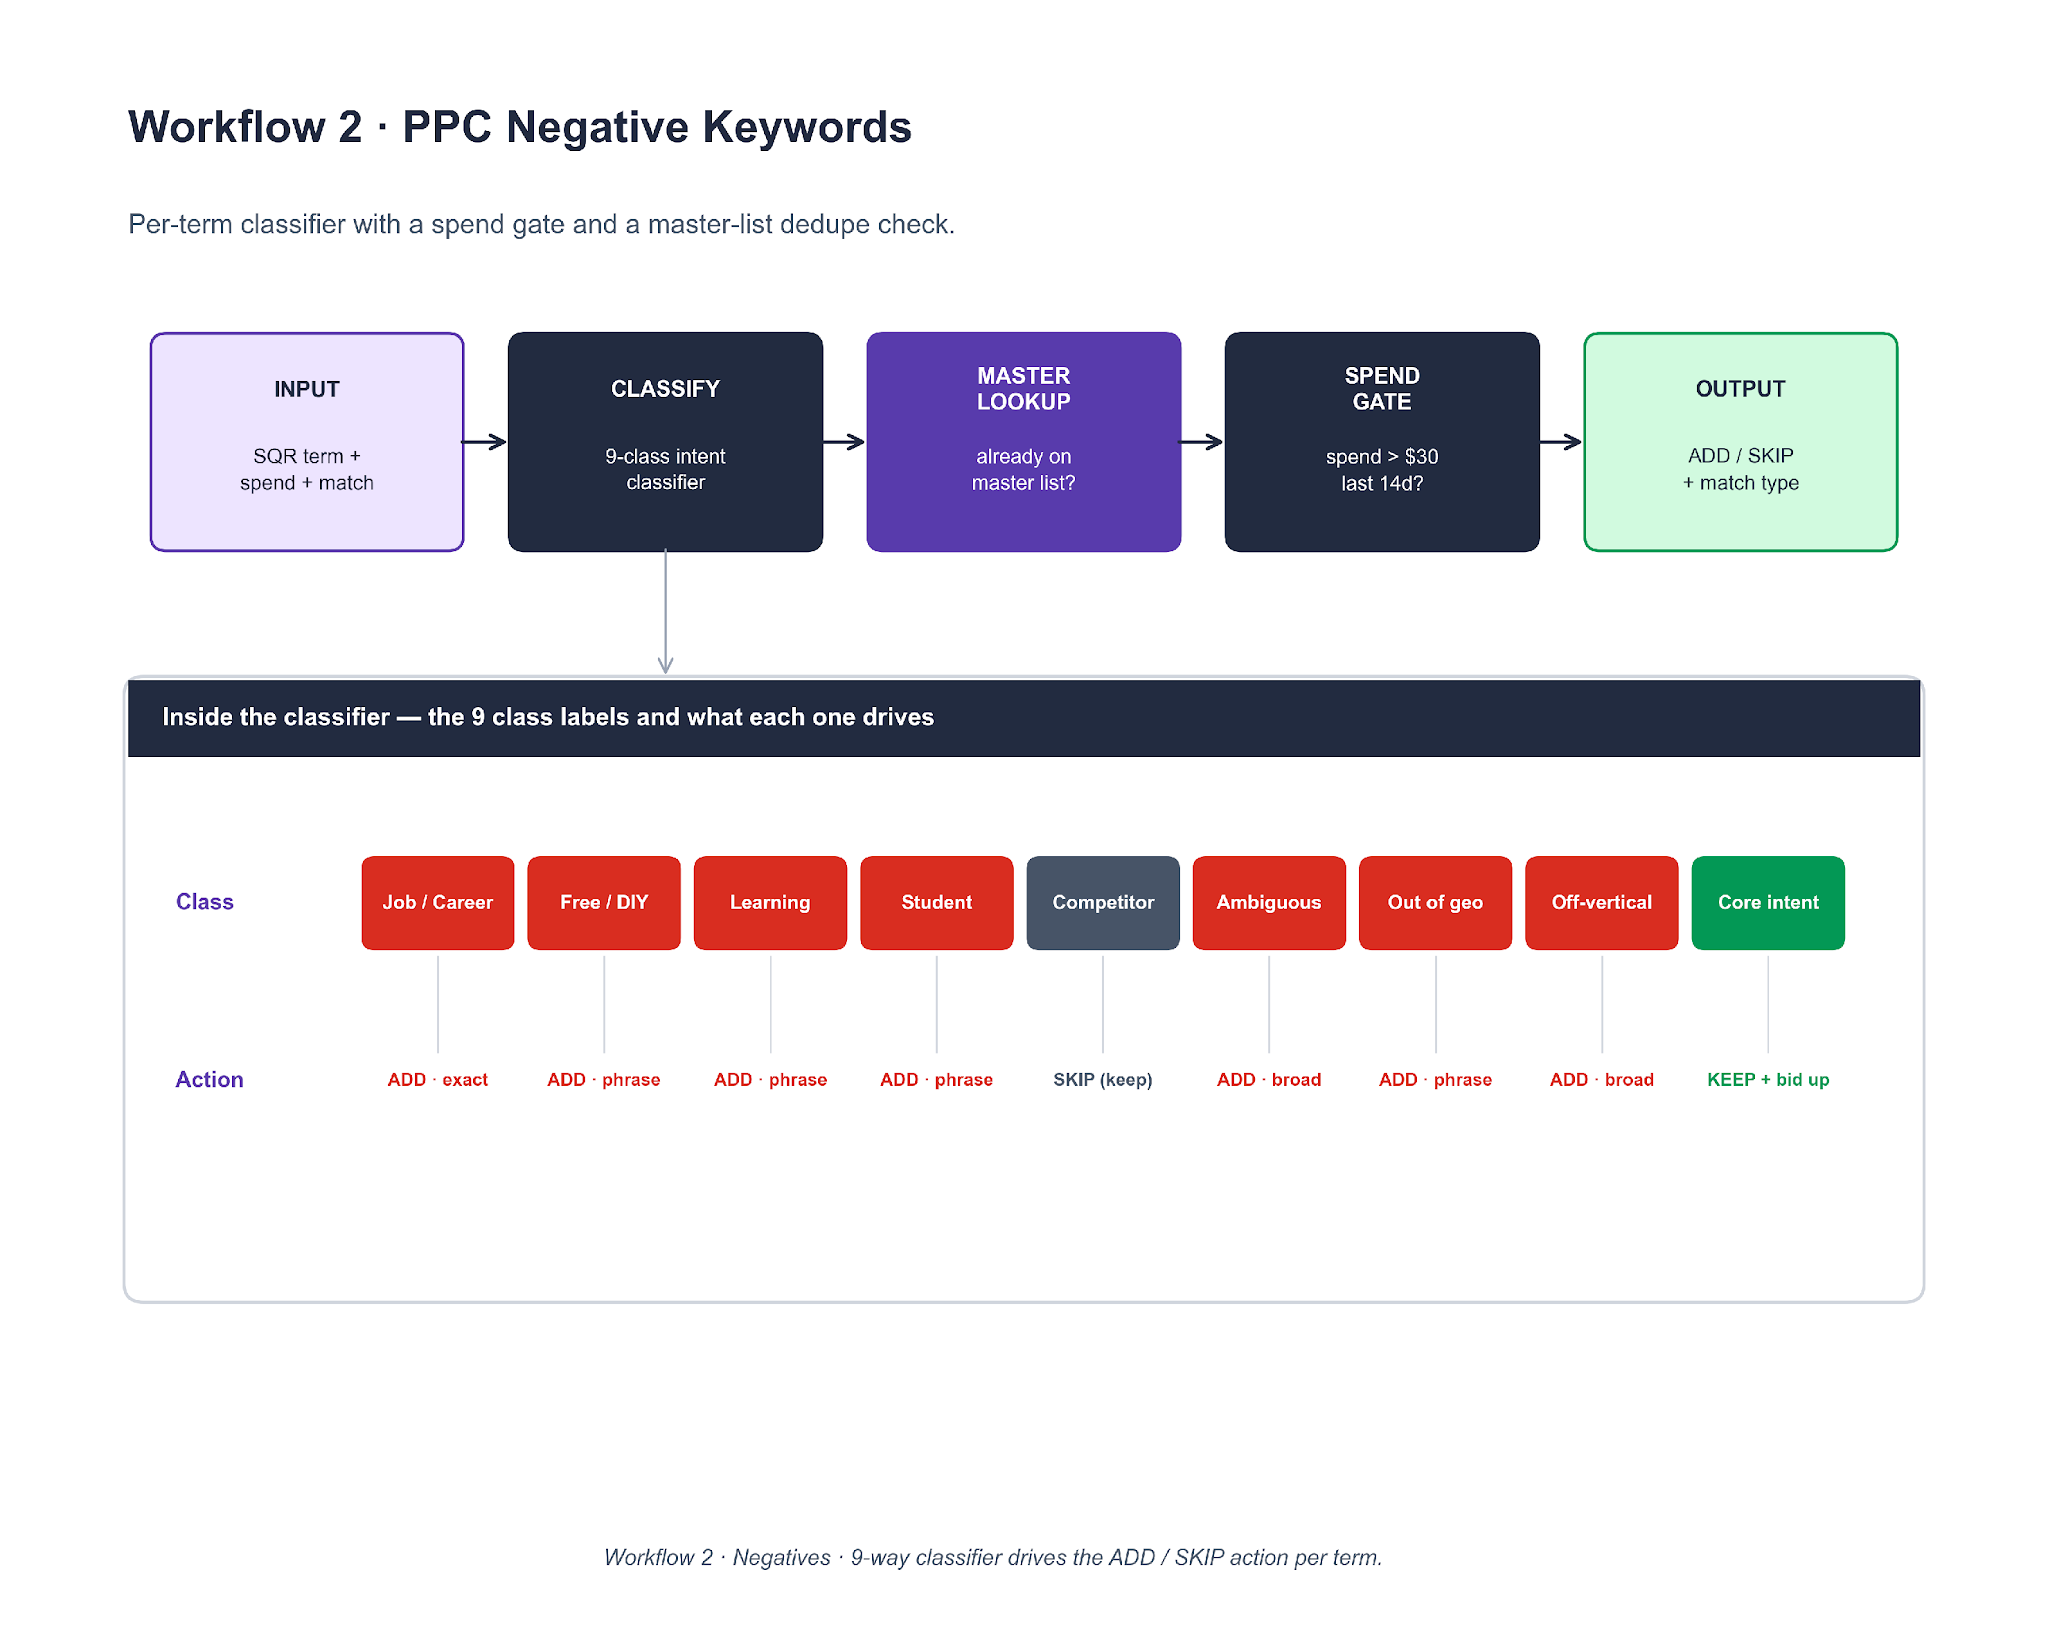
To clone it, the classifier is an LLM call with six few-shot examples per class. The spend gate is a per-client threshold, usually $30 in 14 days. The master-list lookup dedupes against the shared file so the same term is not re-flagged every week. Output is a CSV with columns matching Google Ads Editor's native paste format. Lesson 6's PMax brand absorption surfaced through this workflow, three weeks before it hit the QBR slide.
Workflow 3. Landing Page Match
Three inputs — ad copy, the scraped LP, and the ad-group's query intent — feed a three-dimension scoring rubric. Weights are fixed at 40% H1 similarity, 35% CTA verb match, 25% proof strength. The composite score decides whether the LP is a fix, a rebuild, or a leave-alone.
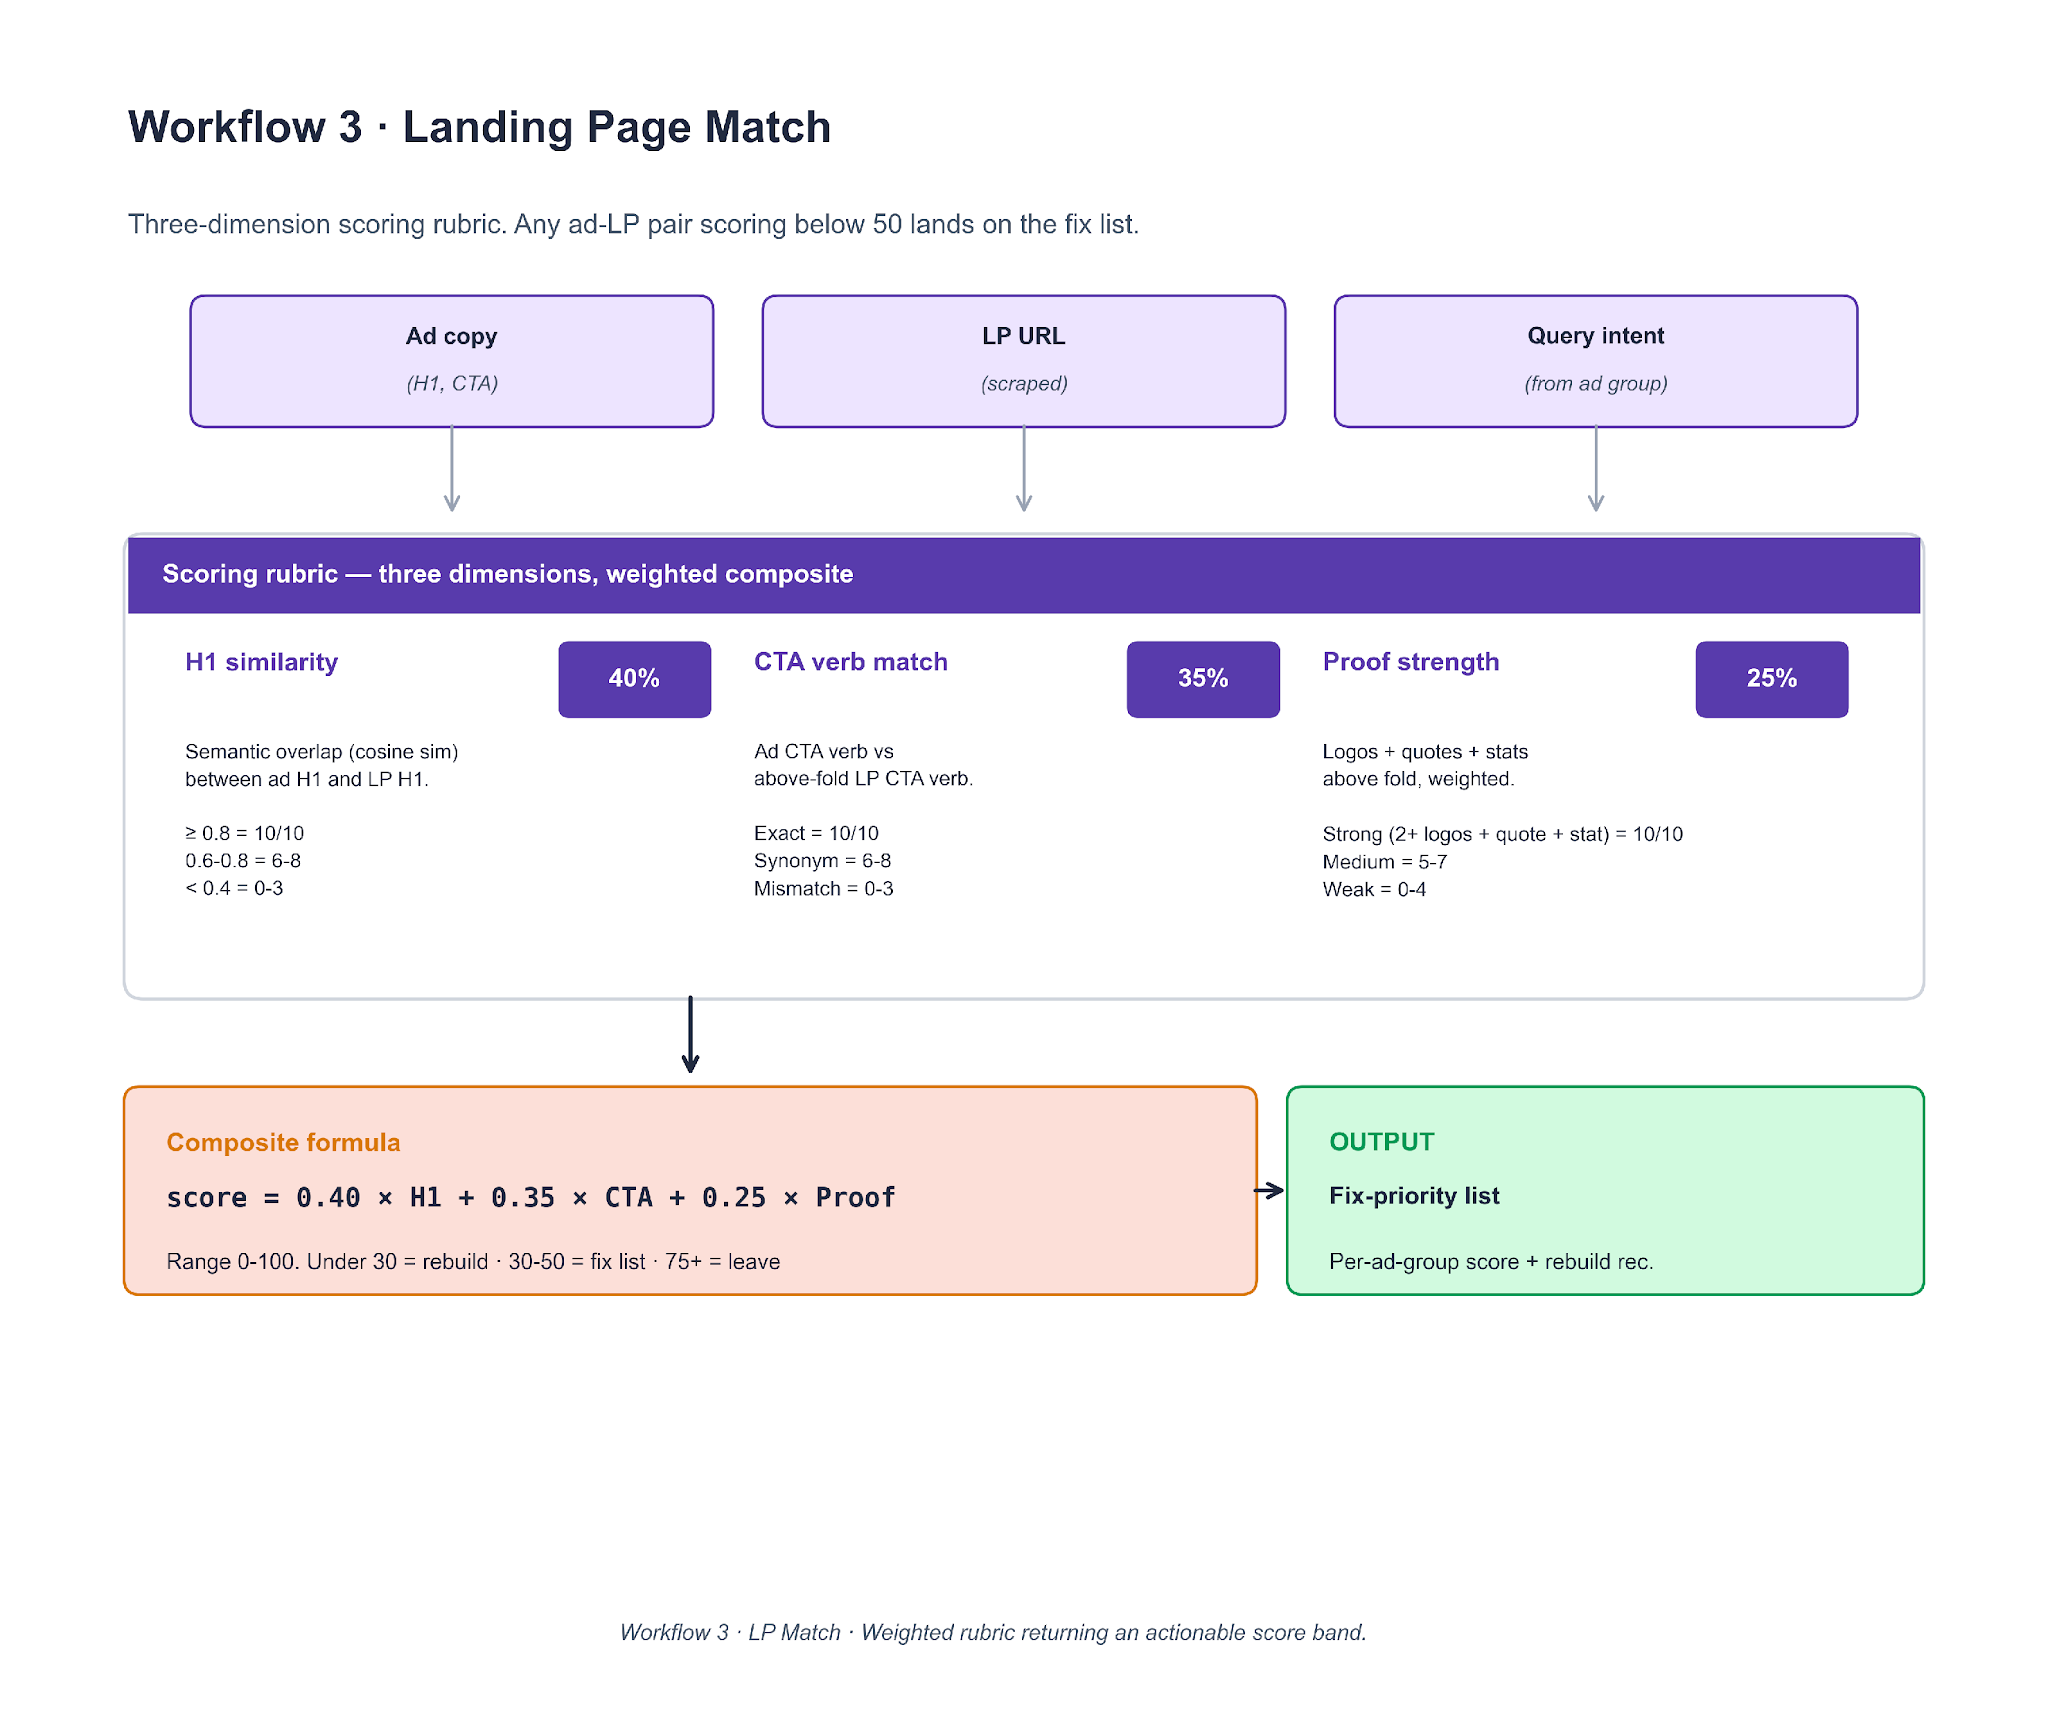
To clone it, scrape the LP with Playwright, extract the H1 and above-fold CTA, and count logos / quotes / stats above the fold. H1 similarity is cosine similarity on embeddings (OpenAI or sentence-transformers). CTA match is an LLM verb comparison. Proof strength is a count-pass with a weighted rule. The score band is actionable: under 30 triggers a rebuild, 30-50 goes on the fix list, 75+ is left alone. The Lesson 3 brand-LP overhaul started as a score of 19 on the secondary-channel brand LP in this workflow's output.
Workflow 4. CRO Audit
An LP URL or screenshot enters a 20-rule engine organized across six categories: headline, above-fold CTA, proof, form, mobile UX, and speed. Each finding is converted into a proposed A/B test and scored on priority = expected_lift × (1 / effort) × risk_factor.
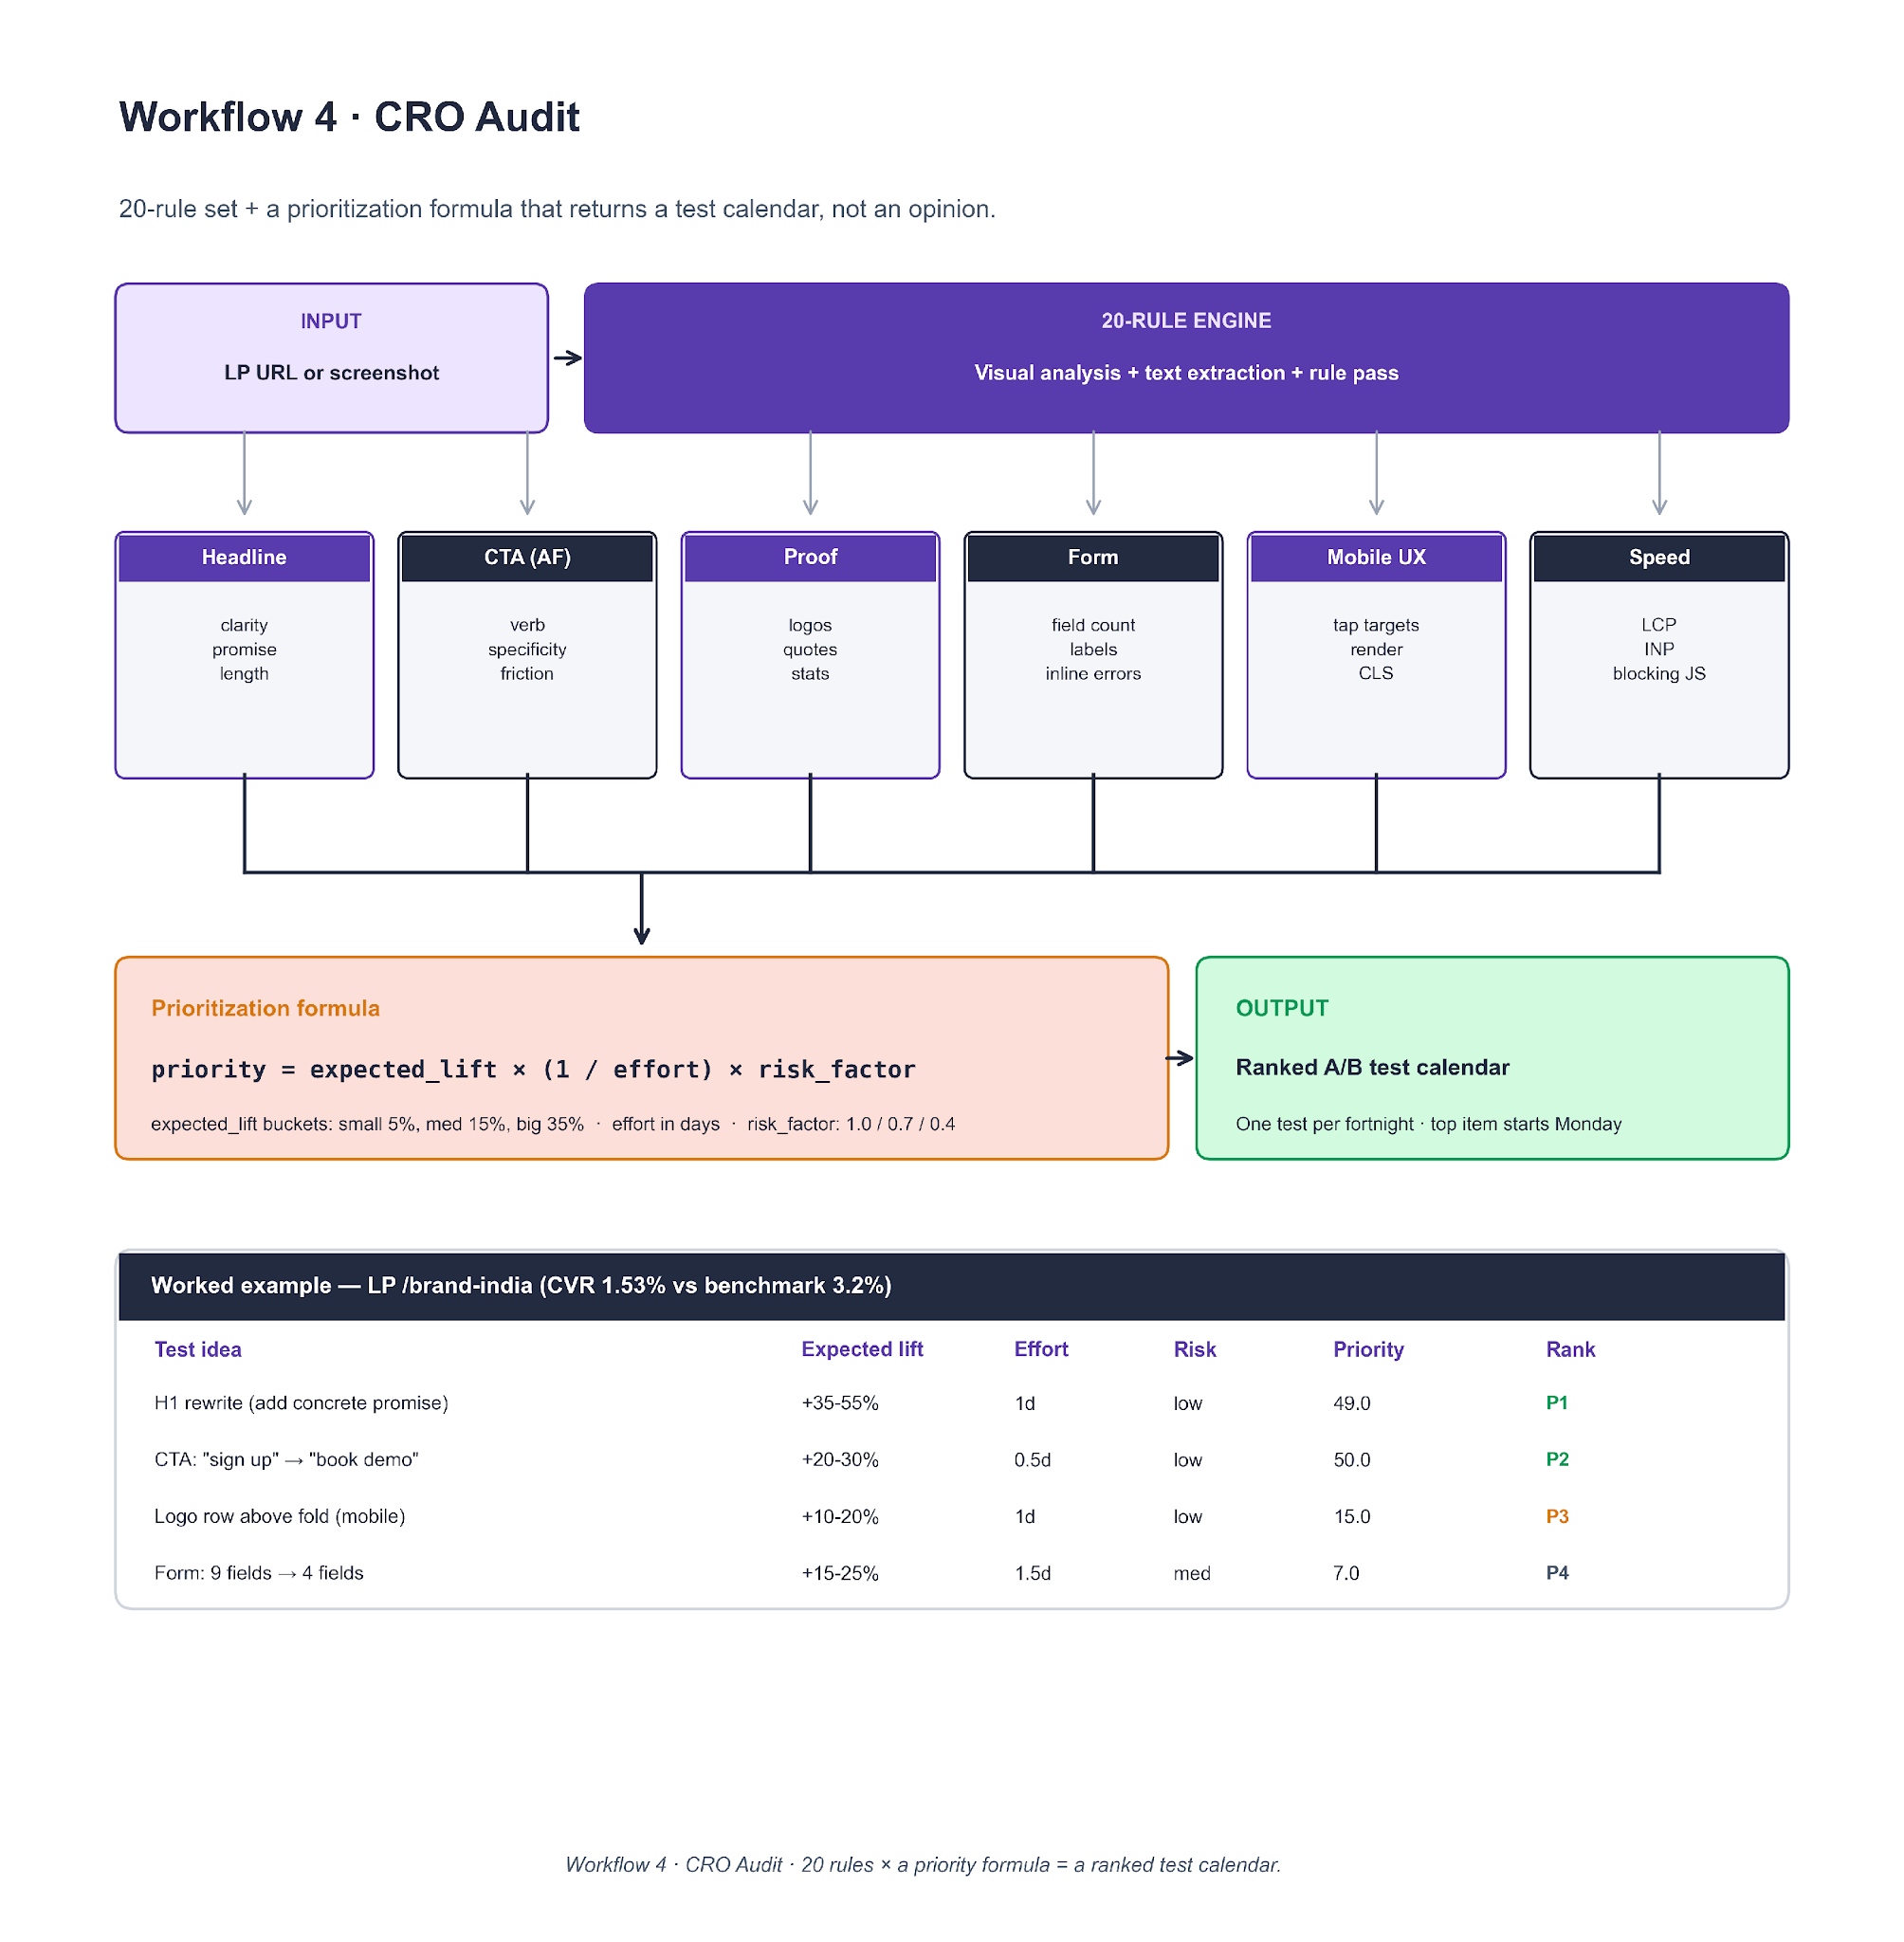
To clone it, encode the 20 rules as YAML. For each rule that fires, the LLM returns (finding, expected_lift_bucket, effort_days, risk_factor). Apply the priority formula, sort, and return a test calendar with one test per fortnight. The worked example at the bottom of the diagram shows four ranked tests on /brand-india — the H1 rewrite and CTA verb swap landed at the top of the calendar because of the low effort and low risk, not because the expected lift was the highest.
Workflow 5. Keyword Research
Five stages: seed list → expand → cluster by intent → tag (match type + volume) → export. The clustering step (k-means on sentence-transformer embeddings) is what keeps the output structured instead of a flat keyword dump.
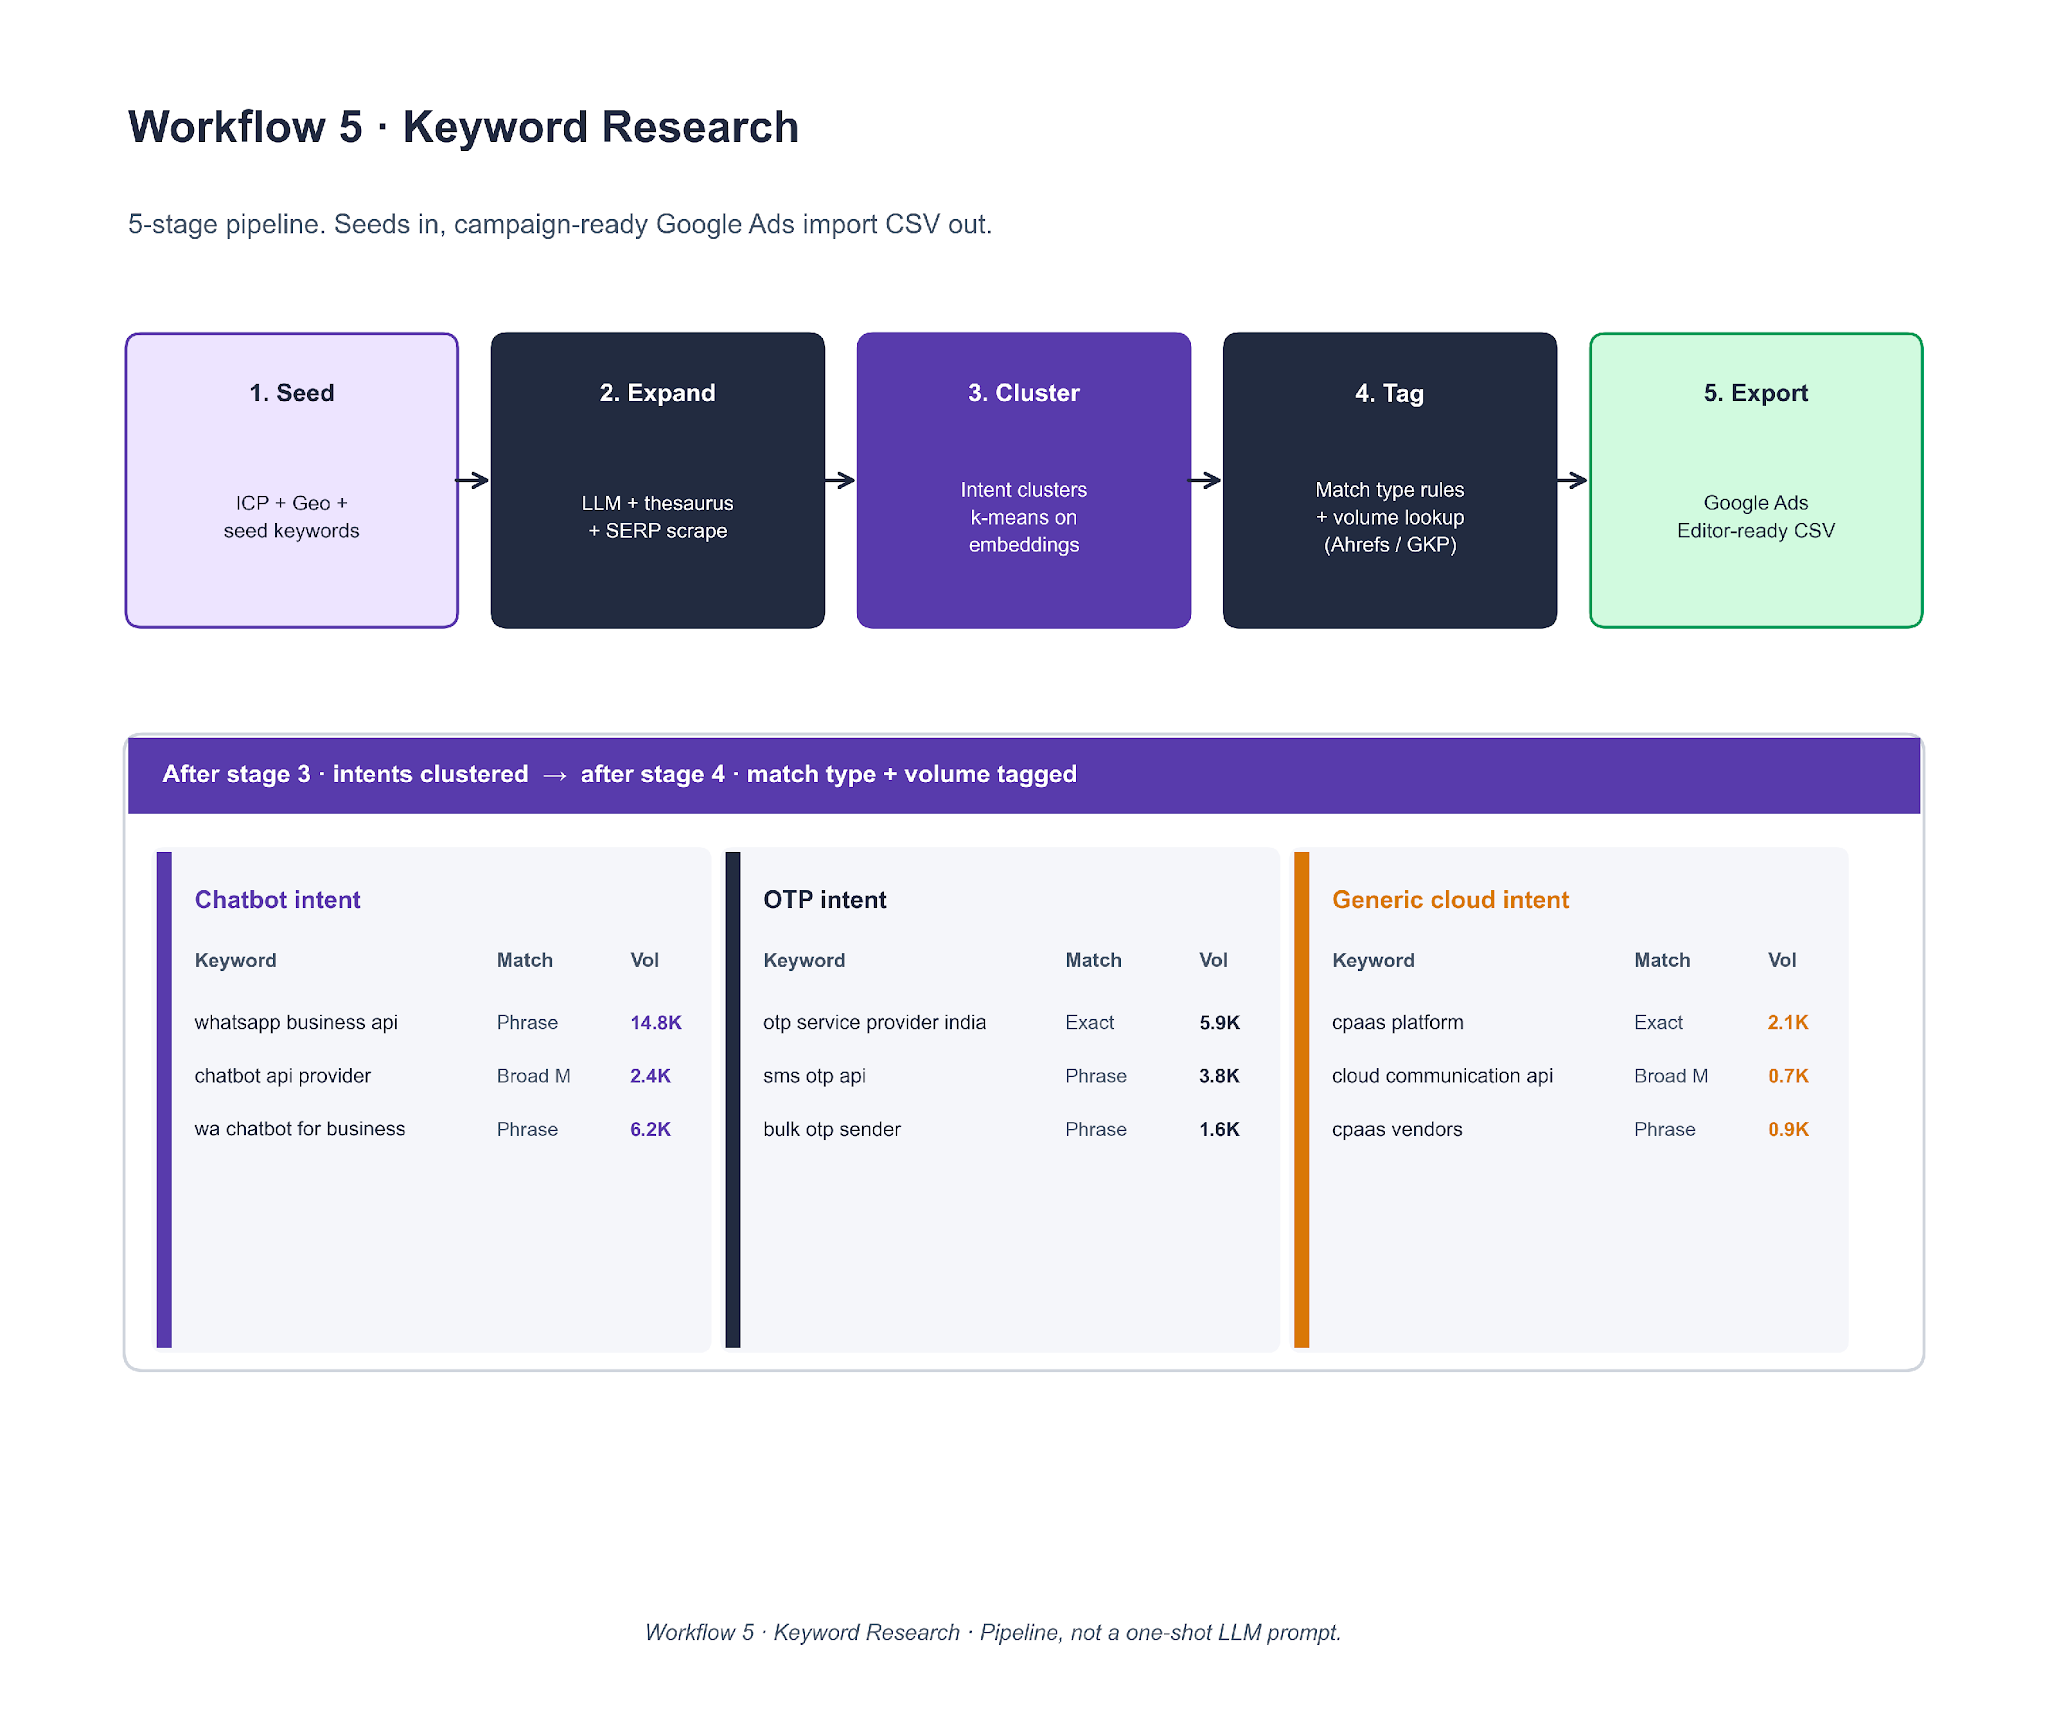
To clone it, start with a 10-20 keyword seed list the client already ranks for. Expand with an LLM prompt that includes ICP and geo; cross-check against a SERP scrape so hallucinated keywords do not survive. Cluster with k-means where k equals the expected number of intents (3-8 is the common band on B2B SaaS accounts). Tag match type with a rule (brand → exact, four-plus words → phrase, otherwise broad match). Pull volume from Ahrefs or GKP. The WhatsApp / Chatbot / OTP intent split on the Lesson 1 CPaaS account came directly out of this pipeline.
Workflow 6. Monthly Paid Report
A cron trigger on the 1st of the month at 8am local pulls from three APIs (Google Ads, LinkedIn Ads, HubSpot) in parallel. Data flows into a transform step (aggregate, MoM delta, MQL routing through HubSpot lifecycle). A 14-slide Google Slides deck gets filled via placeholder replacement, then distributed through Slack and Drive.
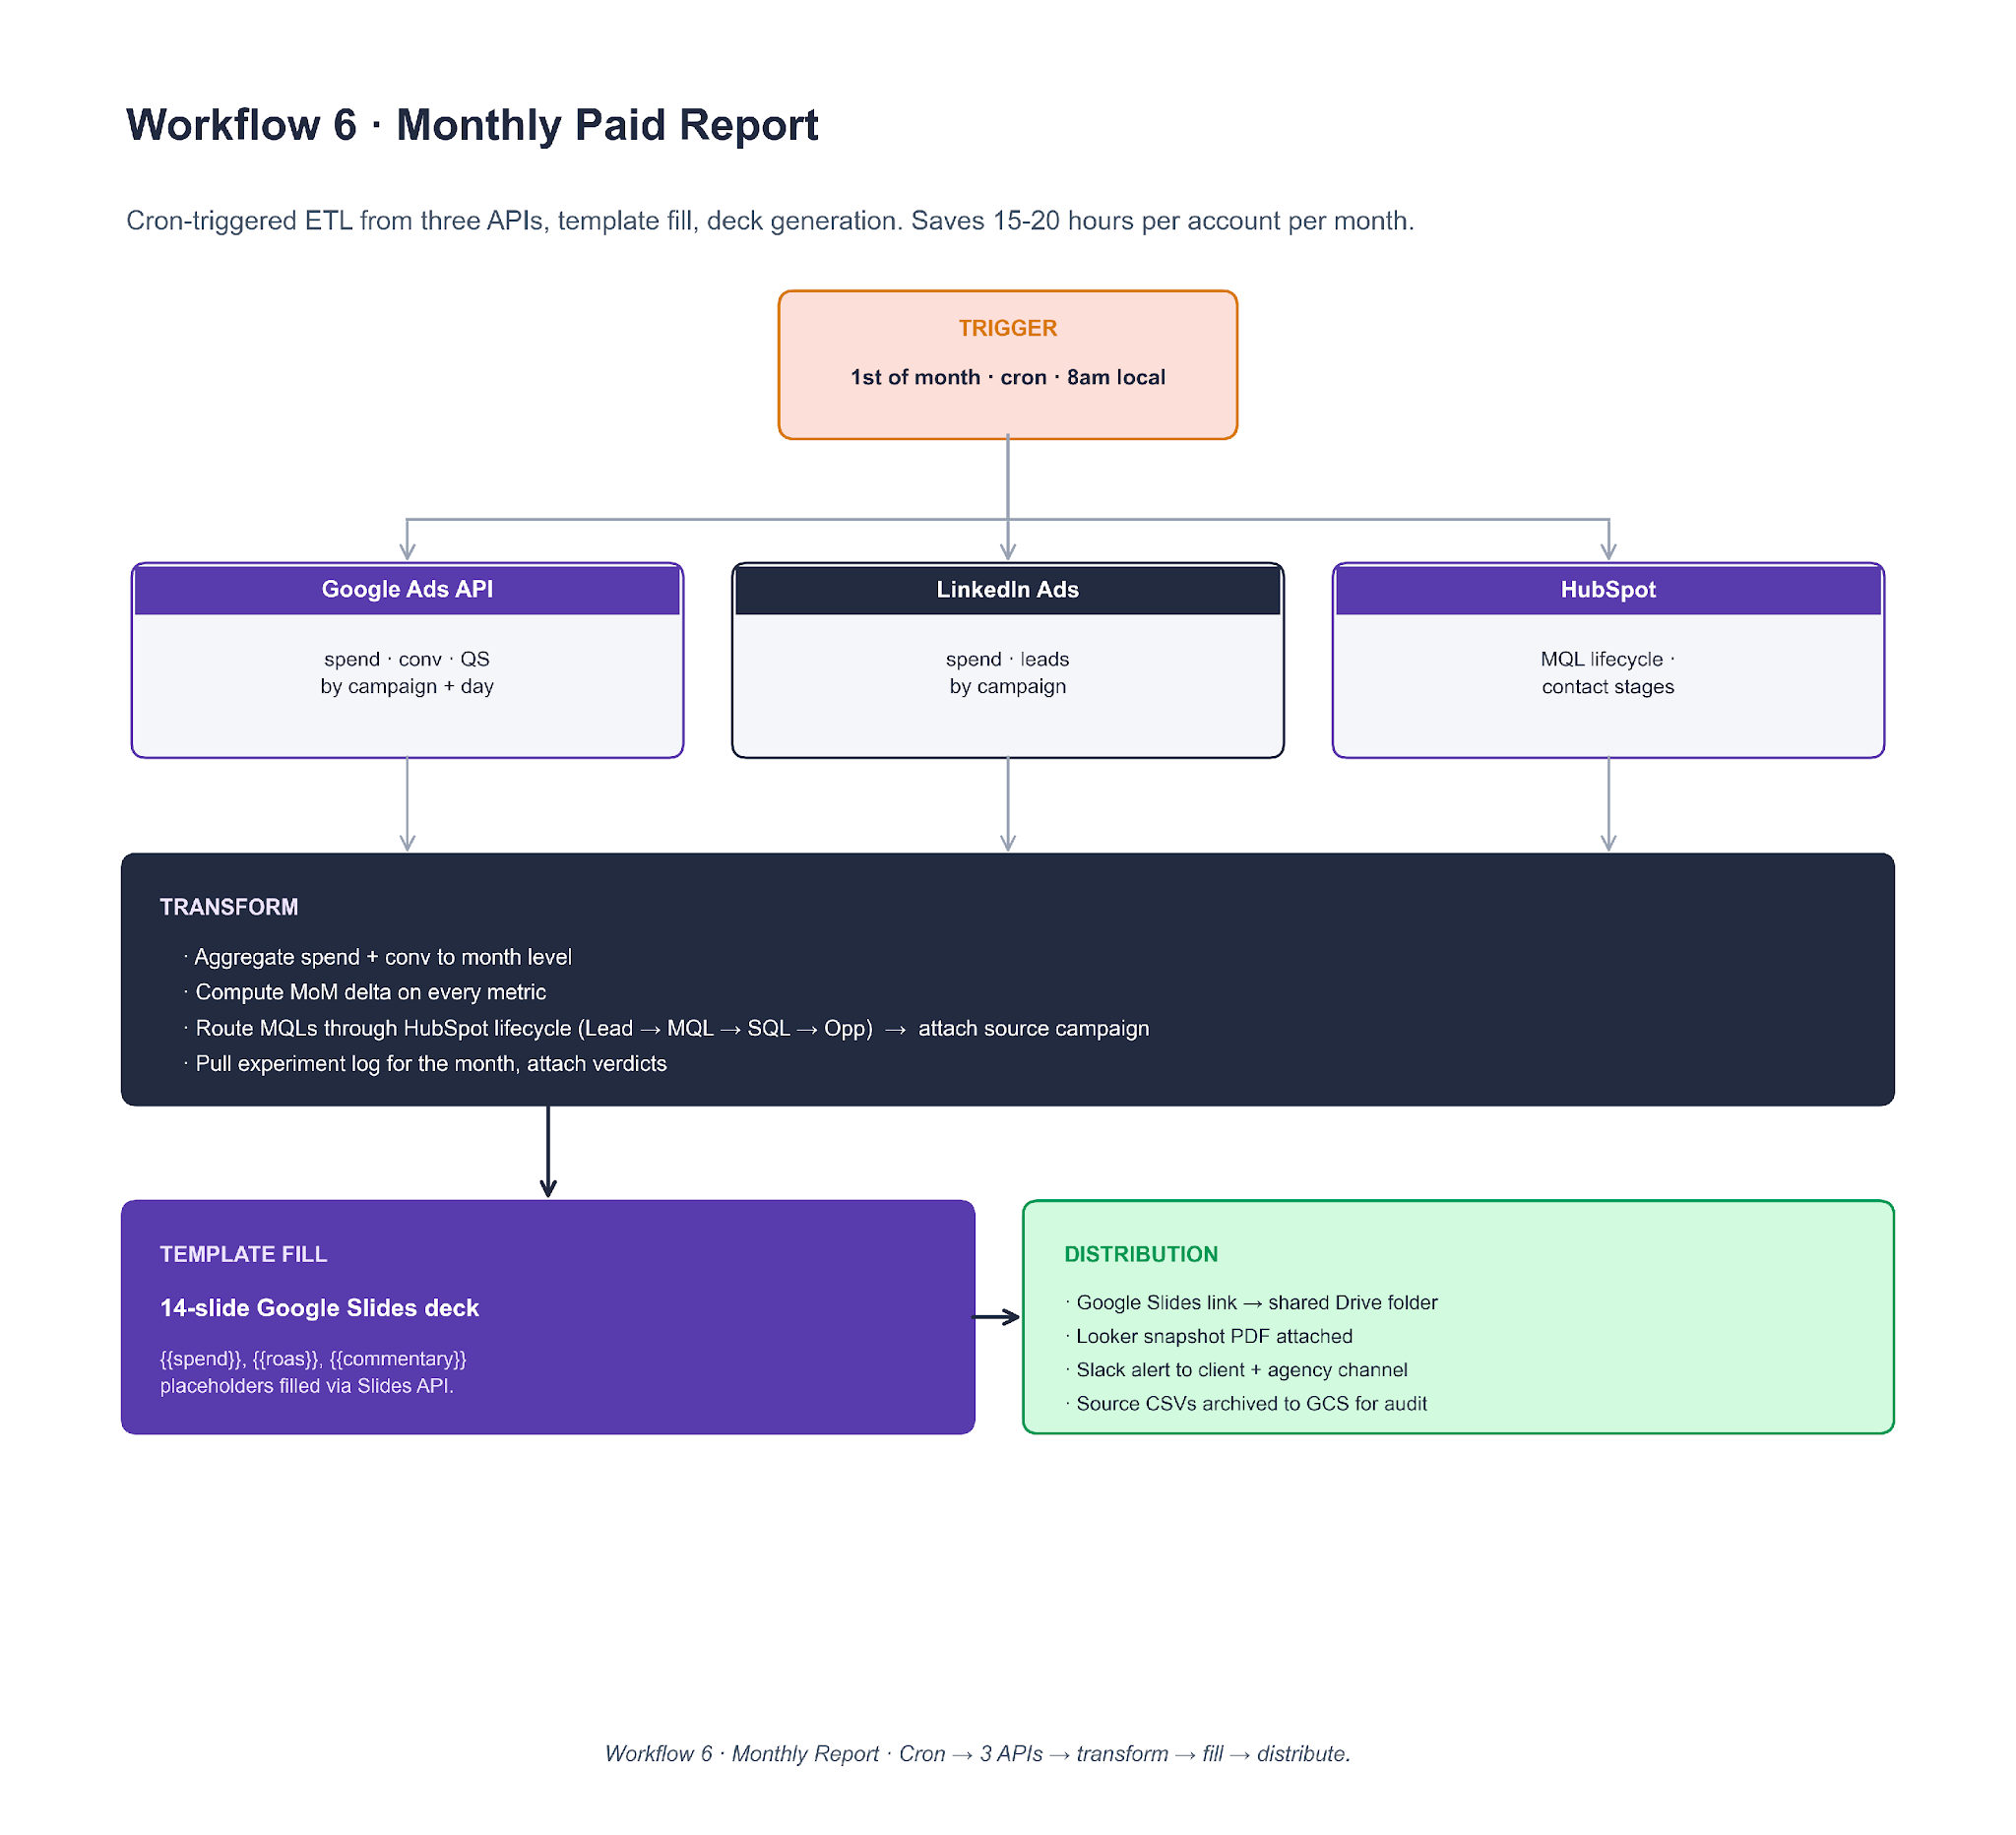
To clone it, a scheduled worker (GitHub Actions, Airflow, or Make.com) pulls with stored OAuth tokens. dbt or pandas handles the transform. Template fill uses the Google Slides API (batchUpdate with replaceAllText requests for every {{placeholder}} in the deck). Client commentary is an LLM pass on the month's data against the prior month. Slack and email distribution close the loop. The point of the workflow is not the report itself. It is the 15 to 20 hours per account per month that the paid media lead reclaims from the reporting cycle.
These are the agency workflows we run internally. If you want us to run the equivalent diagnostic pass on your own account as a one-off, the same strategy call link covers it.
Putting This Quarter Into Practice
The plays in this report worked because the accounts had clean foundations. Negatives were pre-loaded. Attribution was clean. Landing pages matched ad intent.
When those foundations are missing, no bid strategy rescues the account. The quarterly experimentation above only pays off once the plumbing holds.
One frame carries across all six lessons. The bidder-signal loop is the bottleneck on B2B SaaS PPC in 2026. Every play that worked gave the bidder cleaner input, whether that was split-by-intent campaigns, brand-to-LP match, SQL offline imports, manual control on thin audiences, or ROAS headroom on an AI Max variant. Every play that failed starved the bidder of either volume, signal, or control.
Carry that frame into Q2 and you will make better calls on most of the decisions that show up on your own account.
- Before you change the ad layer, ask what signal the bidder is getting.
- Before you change the bid strategy, ask whether the conversion volume exists to train on.
- Before you split a campaign, ask whether the parent has earned it.
Those three questions alone cover most of the quarterly review decisions we walked through here.
We run this as a SaaS PPC agency for B2B software brands from Series A through enterprise. The quarterly field report is how we share what we see without naming the specific accounts. If Q1 put pressure on your paid mix and you want a team running this kind of review on your account next, book a strategy call.
Check out exclusive PPC strategies for 2026 here.
Frequently Asked Questions
Does campaign splitting always reduce cost per opportunity in SaaS PPC?
No. Splitting worked on one account in Q1 because the parent campaign delivered enough volume to keep each child above the 30-conversions-per-month training threshold. On a thinner second account we took over, a prior intent split had fragmented the signal and cost $1,583 for one wrong-intent conversion. Count the parent's monthly conversions before splitting.
Should B2B SaaS companies run dedicated mobile PPC campaigns?
In most B2B SaaS verticals, no. Three separate accounts we manage ran dedicated mobile search campaigns in Q1 2026 and produced zero qualified leads across the quarter. The exceptions sit in mobile-first markets like Brazil, Argentina, and Indonesia, where baseline purchasing behavior is different.
Is Target CPA the right bid strategy for a mature SaaS search campaign?
Only if the campaign already generates 30+ conversions a month. On one account this quarter, a Generic campaign had been moved to tCPA before we came in, and had spent $3,300 for zero conversions before we reverted it. Under 30 conversions a month, Max Conversions with a soft ROAS guardrail is the safer default.
How much should a B2B SaaS company spend on PPC in 2026?
The honest answer is a function of ACV, blended CAC target, LTV:CAC, and pipeline coverage ratio. Our SaaS PPC media planning guide walks through the four numbers and the calculation we use with CMOs and CFOs on every engagement.
Does Performance Max cannibalize branded search?
Yes, by default. Every PMax campaign we launch on a branded SaaS account now starts with a full brand-term negative keyword list. Without that fence, PMax absorbs branded queries at a lower CPC than the Brand campaign and reports signups that belonged to Brand.
What is the cheapest way to improve LinkedIn ads performance on a small ABM audience?
Switch the bid strategy from Maximum Delivery to Manual CPC. On sub-1,500-account audiences in Q1 2026, this single change dropped CPCs 90% and CPMs 70% on the campaigns we moved. The automated bidder overspends on impressions when it cannot find enough click signal to train.
Where does AI Max outperform manual bid strategies?
On campaigns with enough conversion volume to train the bidder and a ROAS target with room to hit. In our 19-test Q1 A/B program on one self-serve SaaS account, AI Max won 11 of 19 tests. All 11 winning tests had tROAS targets roughly 25% below the account baseline.
What is the single biggest unlock in SaaS PPC that most accounts miss?
The attribution layer, not the ad platform. Sending SQL or Opportunity signal from a CRM (HubSpot, Salesforce) back into Google Ads as offline conversions lets the bidder optimize toward pipeline, not form submissions. On one account in Q1 2026, the QBR projected a 20% to 30% reduction in Cost per Opportunity from this single fix.


.webp)


.webp)


.webp)

.webp)
.png)


%20(1).png)


.webp)
.webp)
.webp)


%20Ads%20for%20SaaS%202026_%20Types%2C%20Strategies%20%26%20Best%20Practices%20(1).webp)


.webp)


.webp)


![Creating an Enterprise SaaS Marketing Strategy [Based on Industry Insights and Trends in 2026]](https://cdn.prod.website-files.com/632b673b055f4310bdb8637d/6a218bacea463474377dfd32_34%20-%20Creating%20an%20Enterprise%20SaaS%20Marketing%20Strategy.png)


.webp)


%20Agencies%20for%20B2B%20SaaS%20Compared%20(2026).webp)

.webp)
%20with%20Hubspot.webp)


_%20Expert%20Reviews%20%26%20Comparisons.png)


.webp)


_%20Comparison%2C%20Strengths%2C%20and%20How%20to%20Choose.png)


.webp)


.webp)


.webp)


%20Tools%20in%202026_%20Vetted%20List.webp)


![How to Measure AEO Success: 12 Metrics Beyond Clicks [2026 Framework]](https://cdn.prod.website-files.com/632b673b055f4310bdb8637d/6a0d664b326187e99b3d5960_6%20-%20The%20Ultimate%20Guide%20to%20Measuring%20AEO%20Success%20in%202026.png)
![7-Step Workflow for AEO-Ready Content [2026 Framework]](https://cdn.prod.website-files.com/632b673b055f4310bdb8637d/6a0d55ea88913ede1d3a7123_5%20-%20Workflows%20for%20Optimized%20AEO-Ready%20Content%20Creation.png)
.png)
![How to Structure Content for AEO and GEO [With Templates]](https://cdn.prod.website-files.com/632b673b055f4310bdb8637d/6a0c6a56eb700472e635ff33_1%20-%20How%20to%20Structure%20%20Content%20for%20AEO%20and%20GEO%20%20Summaries%20(2026).png)


.png)
.png)


.webp)

%20Agencies%20in%202027.webp)
.webp)
![Top 9 AI SEO Content Generators for 2026 [Ranked & Reviewed]](https://cdn.prod.website-files.com/632b673b055f4310bdb8637d/6a2a3e3105bc1a127aae4e8e_34%20-%20Top%209%20AI%20SEO%20Content%20Generators%20for%202026%20%5BRanked%20%26%20Reviewed%5D.webp)


.avif)