AI-Powered Meta Ads Reporting: Replace Dashboard Juggling with a Single Prompt

Key Takeaways
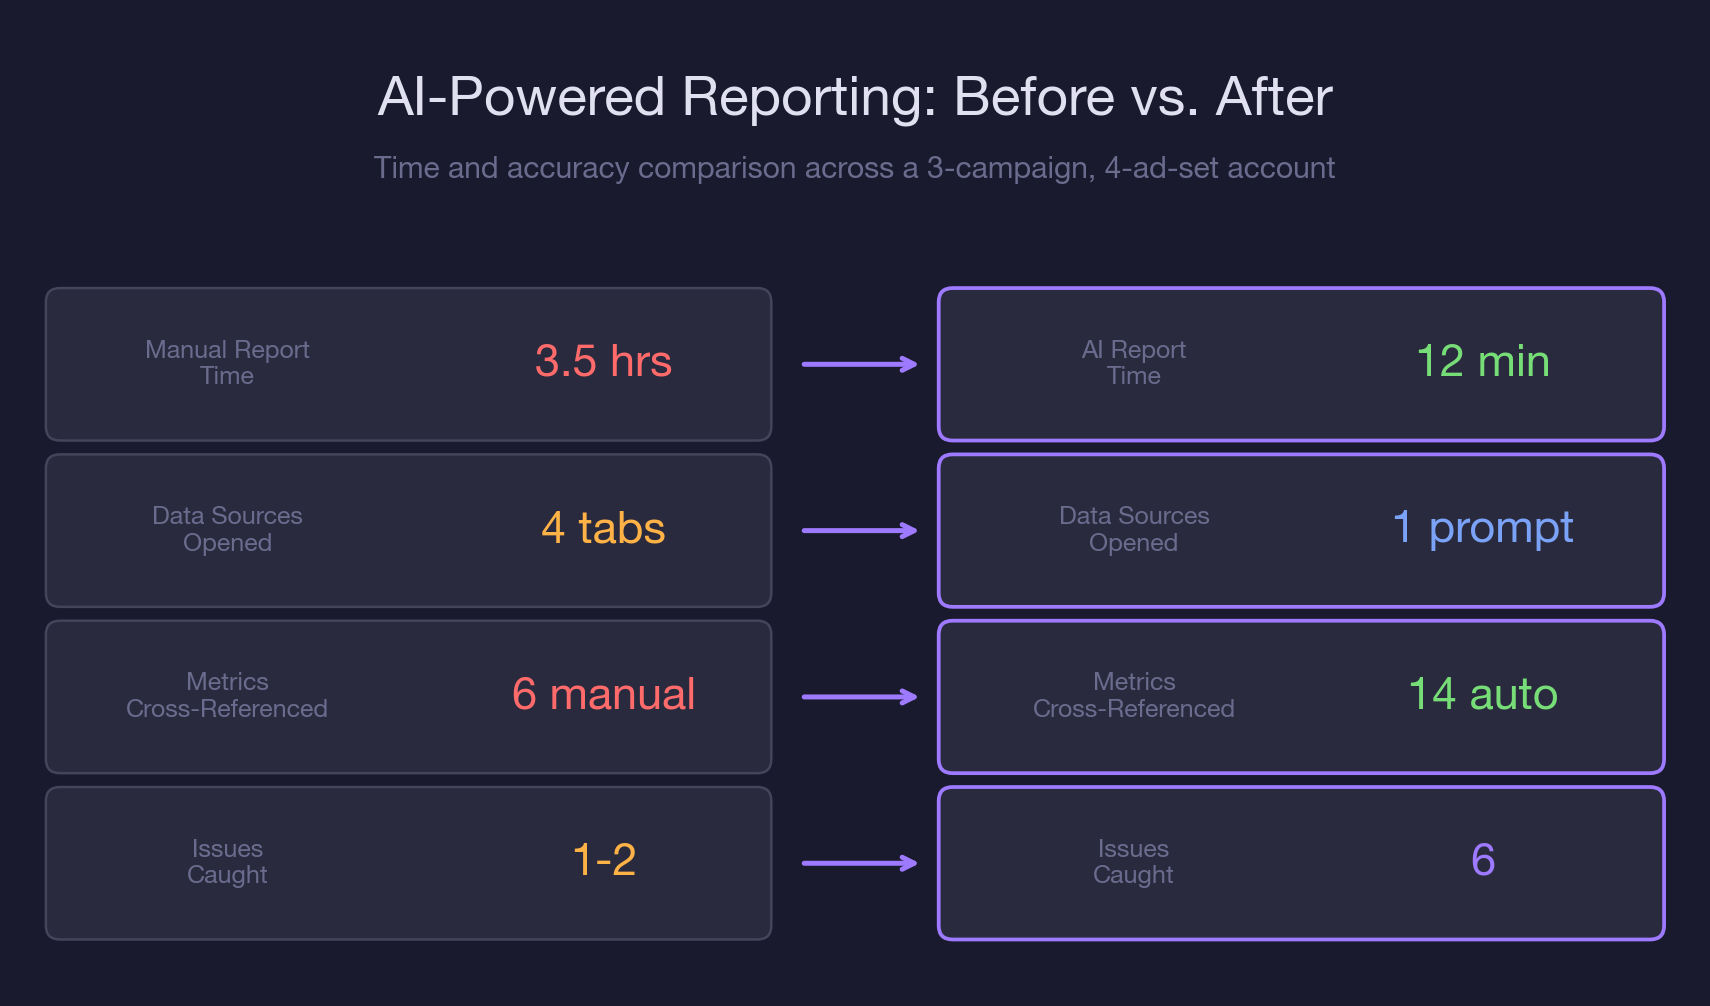
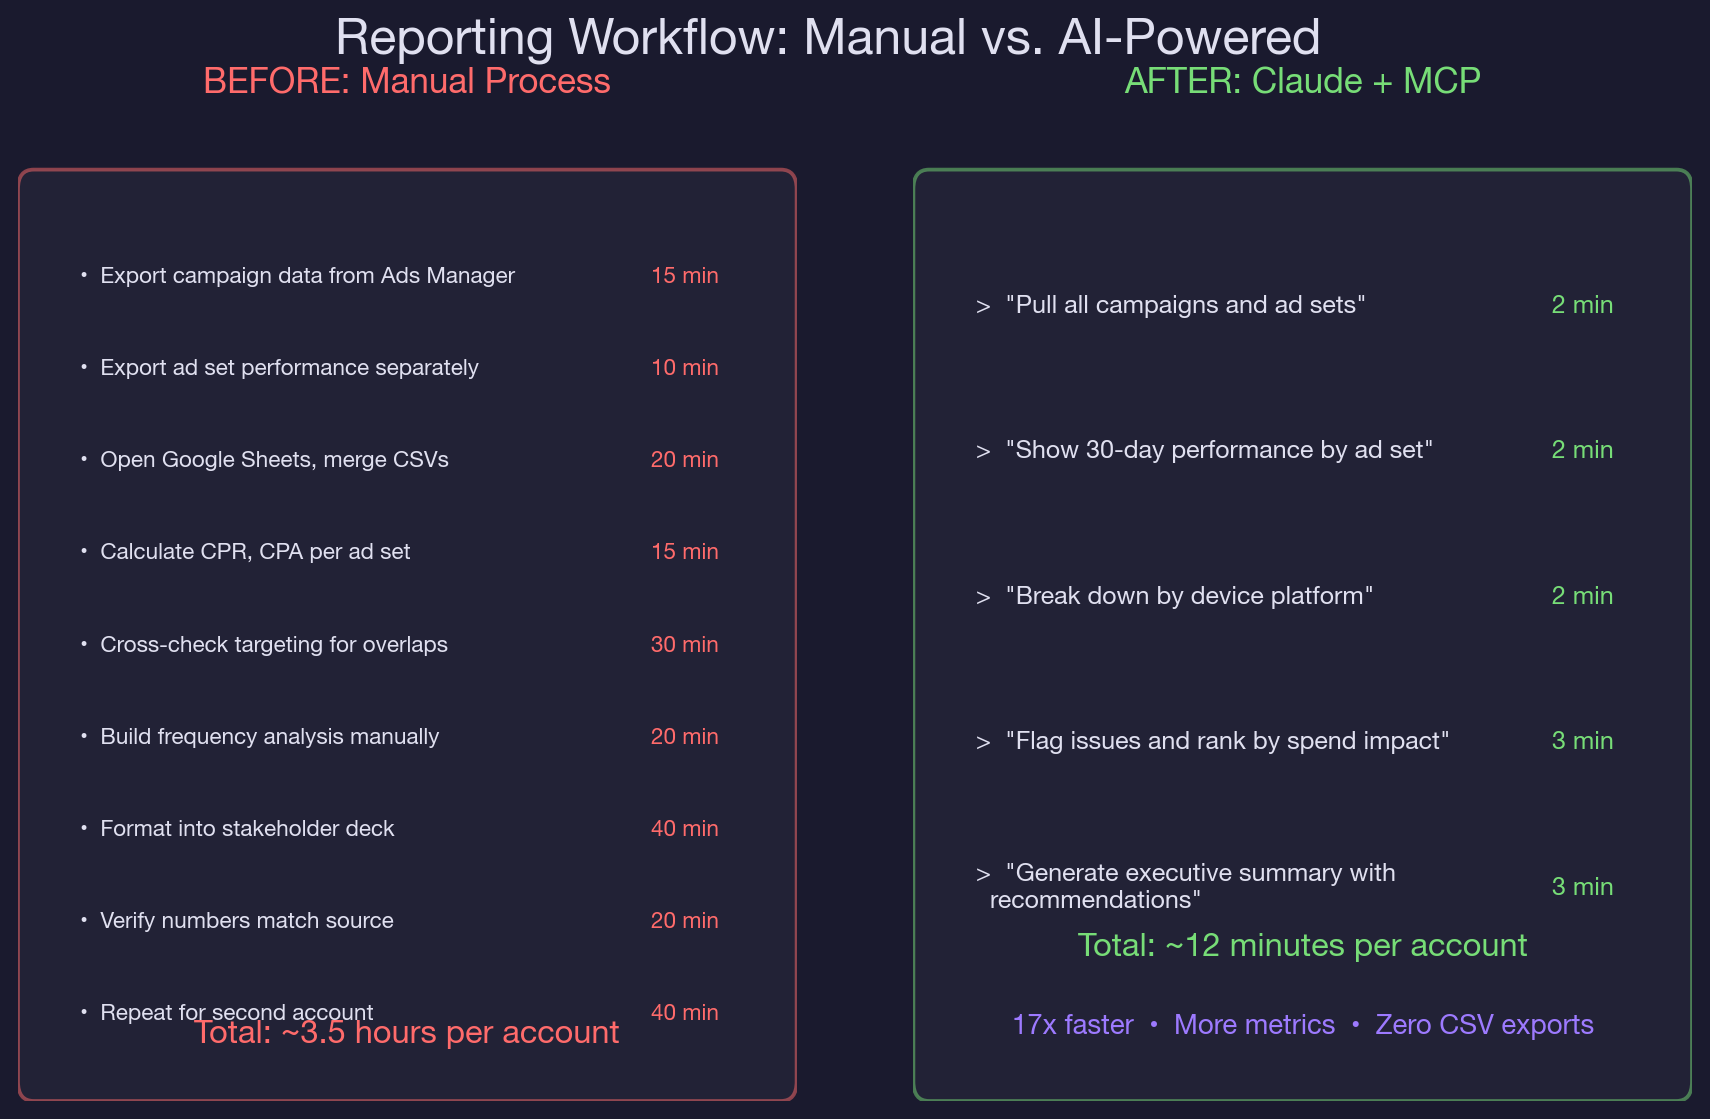
- A three-campaign, four-ad-set Meta Ads account takes 3.5 hours to report manually and 12 minutes with Claude and MCP.
- Campaign-level reporting masks ad-set-level performance gaps. The retargeting ad set in our test account produced 44% of registrations on 26% of budget, invisible in campaign-level averages.
- Awareness campaigns with no conversion tracking can spend $1,263/month while appearing healthy in the Ads Manager summary. Claude flags the objective-KPI mismatch automatically.
- Cross-ad-set frequency stacking is invisible in standard reporting. Three ad sets at 1.5x frequency each can deliver 4.5x to shared audience segments.
- The five-step prompt sequence (structure, performance, breakdown, analysis, summary) is repeatable across accounts and produces a stakeholder-ready report without CSV exports.
- Live MCP data eliminates the snapshot problem. Reports built from day-old CSV exports miss performance shifts that happened since the export.
- Multi-account reporting in Claude catches systemic issues like shared audience pollution and stale custom audiences that single-account reports miss entirely.
Meta Ads Manager stores the data you need in four different places. Campaign objectives live in one view. Ad set performance lives in another. Targeting configs require clicking into each ad set individually. Device and platform breakdowns need a separate column toggle.
No single export gives you the full picture, so you end up stitching it together manually, week after week, hoping you did not miss a column.
Claude and the Meta Ads MCP connector collapse that entire process into a single conversation.
One prompt pulls campaigns, ad sets, and 30-day performance data. A follow-up adds device breakdowns. Claude cross-references spend, registrations, frequency, and targeting configs in context, then generates the summary you would have spent hours building by hand.
In our complete guide to AI-powered paid social management, we covered the full range of what Claude and MCP can do with Meta Ads data. This article focuses on one specific workflow: building your weekly (or daily) Meta Ads report in 12 minutes instead of 3.5 hours.
You will walk away with a five-step reporting prompt sequence, a cross-campaign performance matrix that auto-flags issues by severity, and the exact MCP calls that turn raw API data into an executive summary. If your team is still manually detecting creative fatigue or running account audits by hand, this reporting workflow is the layer that ties those individual analyses into a single, repeatable output.
Why Meta Ads Reporting Breaks at Scale
Meta Ads Manager was designed for campaign management, not cross-campaign analytics. When you have one campaign with two ad sets, the default reporting view works fine. When you have three campaigns with different objectives, four ad sets with different targeting strategies, and a mix of awareness and conversion goals, the default view actively misleads you.
Here is what breaks:
- No unified cost-per-conversion view across campaigns with different objectives. Your awareness campaign reports CPM. Your conversion campaigns report cost-per-registration. Comparing them requires a manual denominator swap that Ads Manager does not offer in a single table.
In a recent account we manage, the awareness campaign spent $1,263 over 30 days with zero conversion tracking attached. It looked fine in the campaign summary because it was optimized for reach, and it hit its reach targets. But from a pipeline perspective, that is $1,263 with no measurable path to revenue. You only catch that by comparing campaign objectives against business KPIs, and Ads Manager does not do that for you.
- Frequency data hides behind column toggles. If your retargeting ad set shows a frequency of 2.0x and your lookalike ad set shows 1.7x, both numbers look healthy in isolation. But if those ad sets share 30% audience overlap, some users are seeing ads 4-5 times per week across ad sets. That compound frequency does not appear anywhere in the standard reporting view.
The audience overlap problem feeds directly into misleading frequency data, which feeds into inflated CPMs, which shows up as "performance decline" in your weekly report. Without cross-referencing these metrics in context, you are reporting symptoms instead of causes.
- Export-merge-format cycles eat hours. A single account with three campaigns requires at least two CSV exports (campaign-level and ad-set-level), a manual merge in Sheets, custom formulas for derived metrics like CPR and ROAS, and formatting into a stakeholder-ready deck. For agencies managing ten accounts, that is 35 hours per week on reporting alone.
The weekly performance report workflow we built for Google Ads solved the same structural problem: too many data sources, too many manual joins, too little time. The Meta Ads version is even more critical because Meta's data model spreads targeting, performance, and audience data across three separate API endpoints. Claude and MCP unify all three in a single session.
- Ad-level creative data requires yet another view. If your stakeholder asks which ad creative drove the most registrations, you need to drill into the ad-level view, which is a separate export from the ad set and campaign views. That is a third CSV and another round of VLOOKUP formulas.
How Claude + MCP Replaces Your Entire Reporting Stack
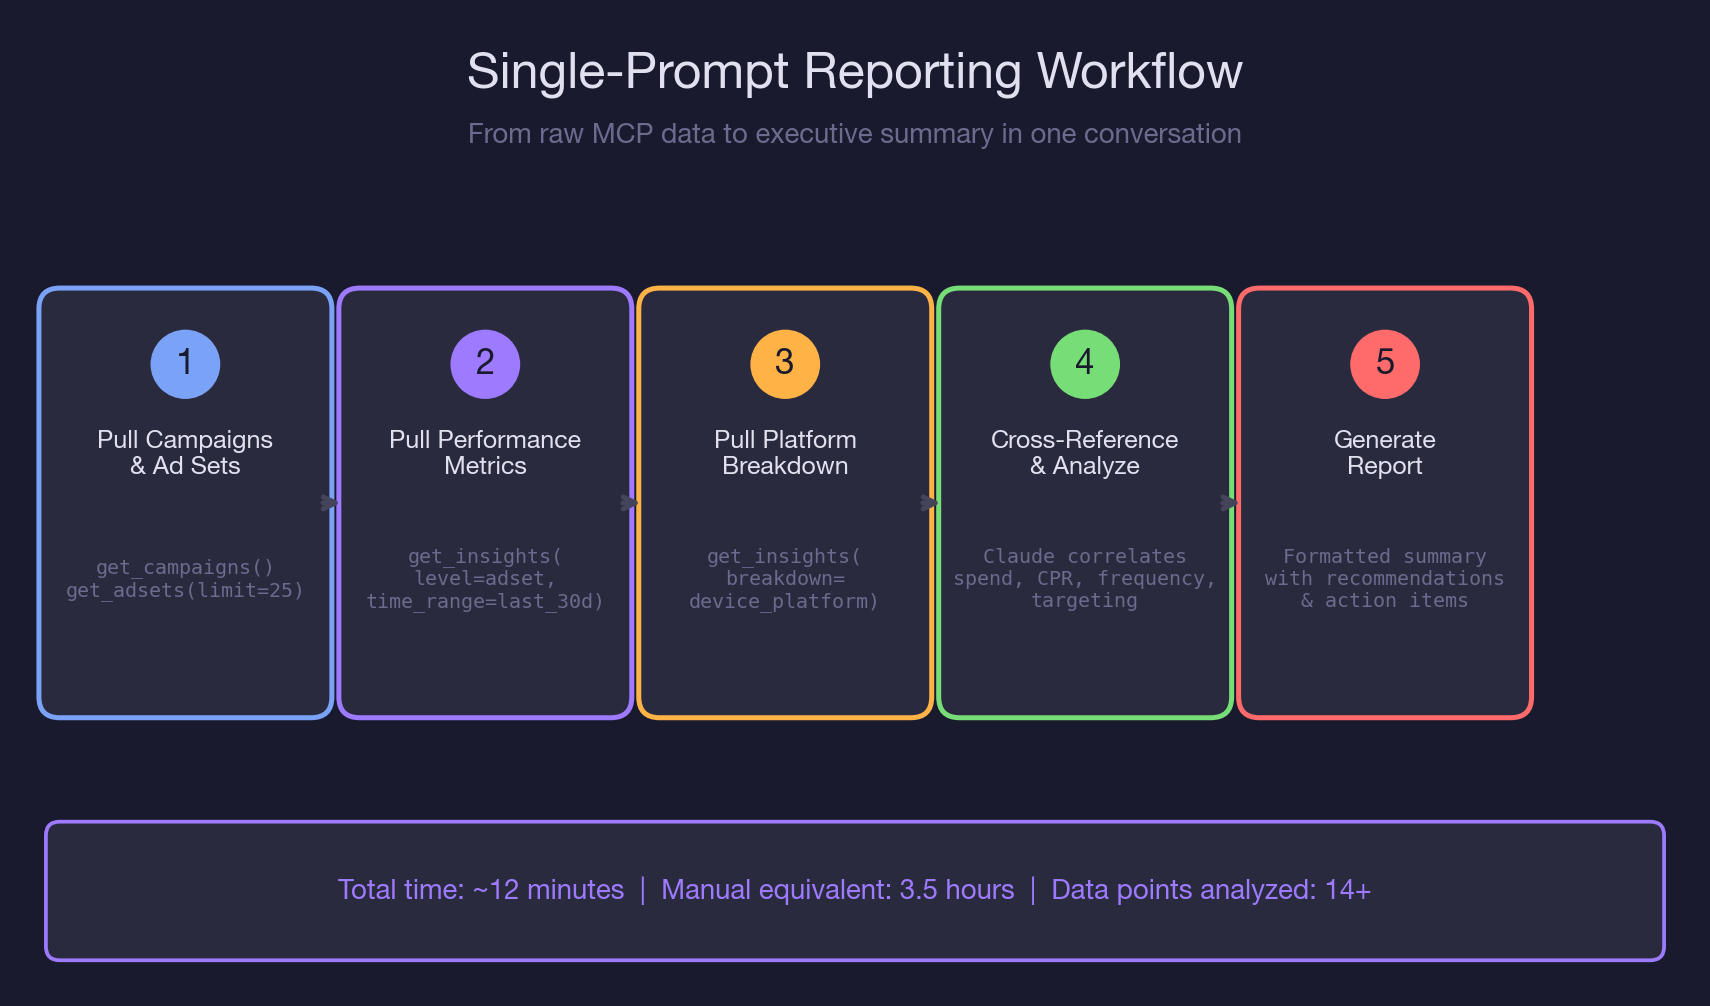
The reporting workflow is a five-step prompt sequence. Each step uses a specific MCP call, and Claude chains the outputs to build a unified report that would normally require three exports and an hour of spreadsheet work.
Step 1: Pull Campaign Structure (2 minutes)
Prompt: "Pull all active campaigns and ad sets for my Meta Ads account. Show me the campaign name, objective, bid strategy, daily budget, and optimization goal for each ad set."
Claude calls get_campaigns() and get_adsets(limit=25) via MCP. In a typical B2B SaaS account, this returns the full campaign architecture in seconds. You immediately see structural issues: an awareness campaign with no conversion event, a conversion campaign using lowest-cost bidding instead of cost cap, or an ad set with a daily budget that does not match its performance tier.
This is the step that replaces the "open Ads Manager, click into each campaign, note down the settings" phase that takes 15 minutes manually. Claude formats the output as a comparison table, so you can spot mismatches without toggling between campaigns.
Step 2: Pull Ad Set Performance (2 minutes)
Prompt: "Now pull the last 30 days of performance data at the ad set level. Show me spend, impressions, reach, frequency, link clicks, landing page views, registrations, and cost per registration for each ad set."
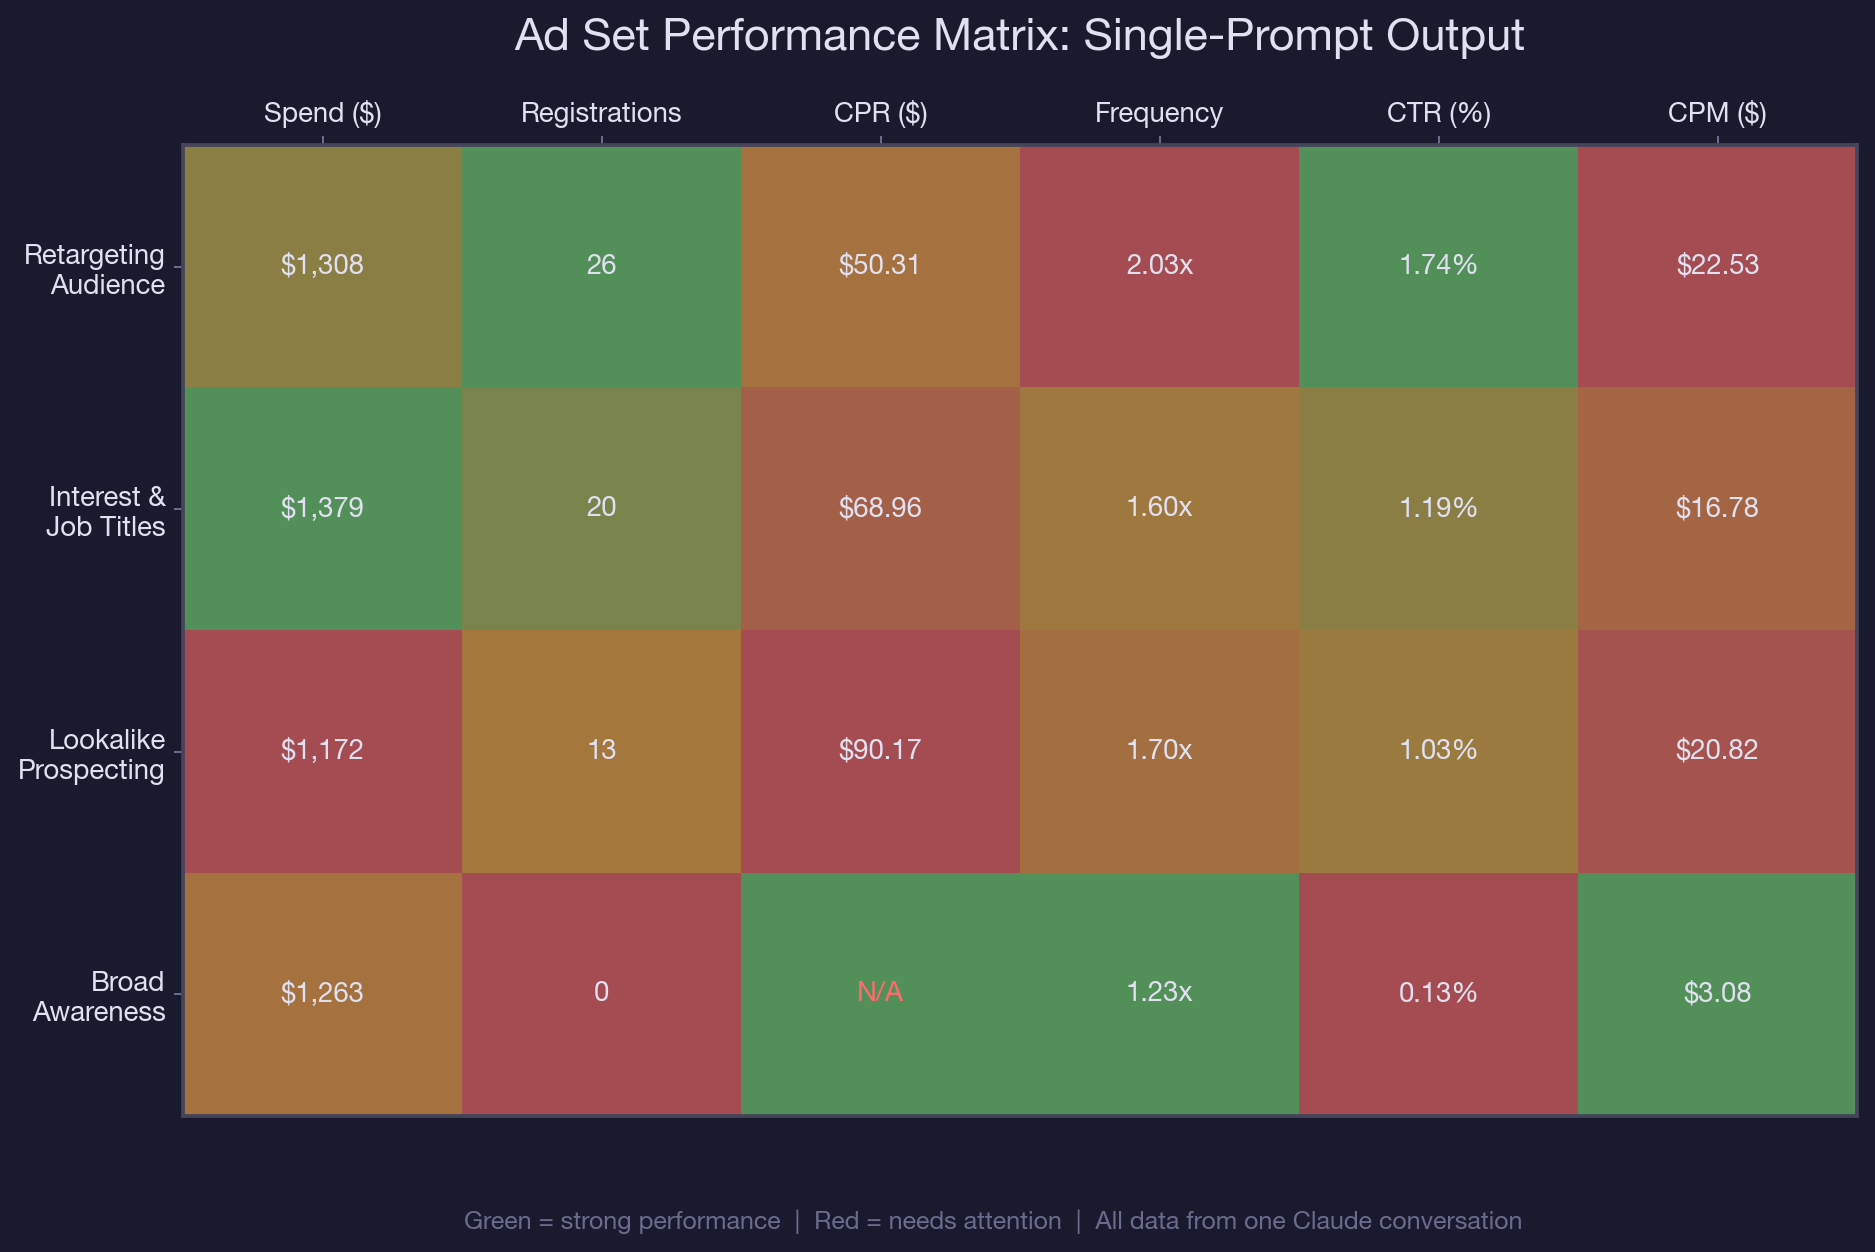
Claude calls get_insights(level=adset, time_range=last_30d). This is the step where reporting tools like Ads Manager fall short, because the performance data and the targeting data live in separate views. Claude already has the targeting context from Step 1, so when it sees a lookalike ad set with a $90.17 CPR versus a retargeting ad set at $50.31, it can immediately flag that the 79% cost gap may be related to targeting overlap or audience quality.
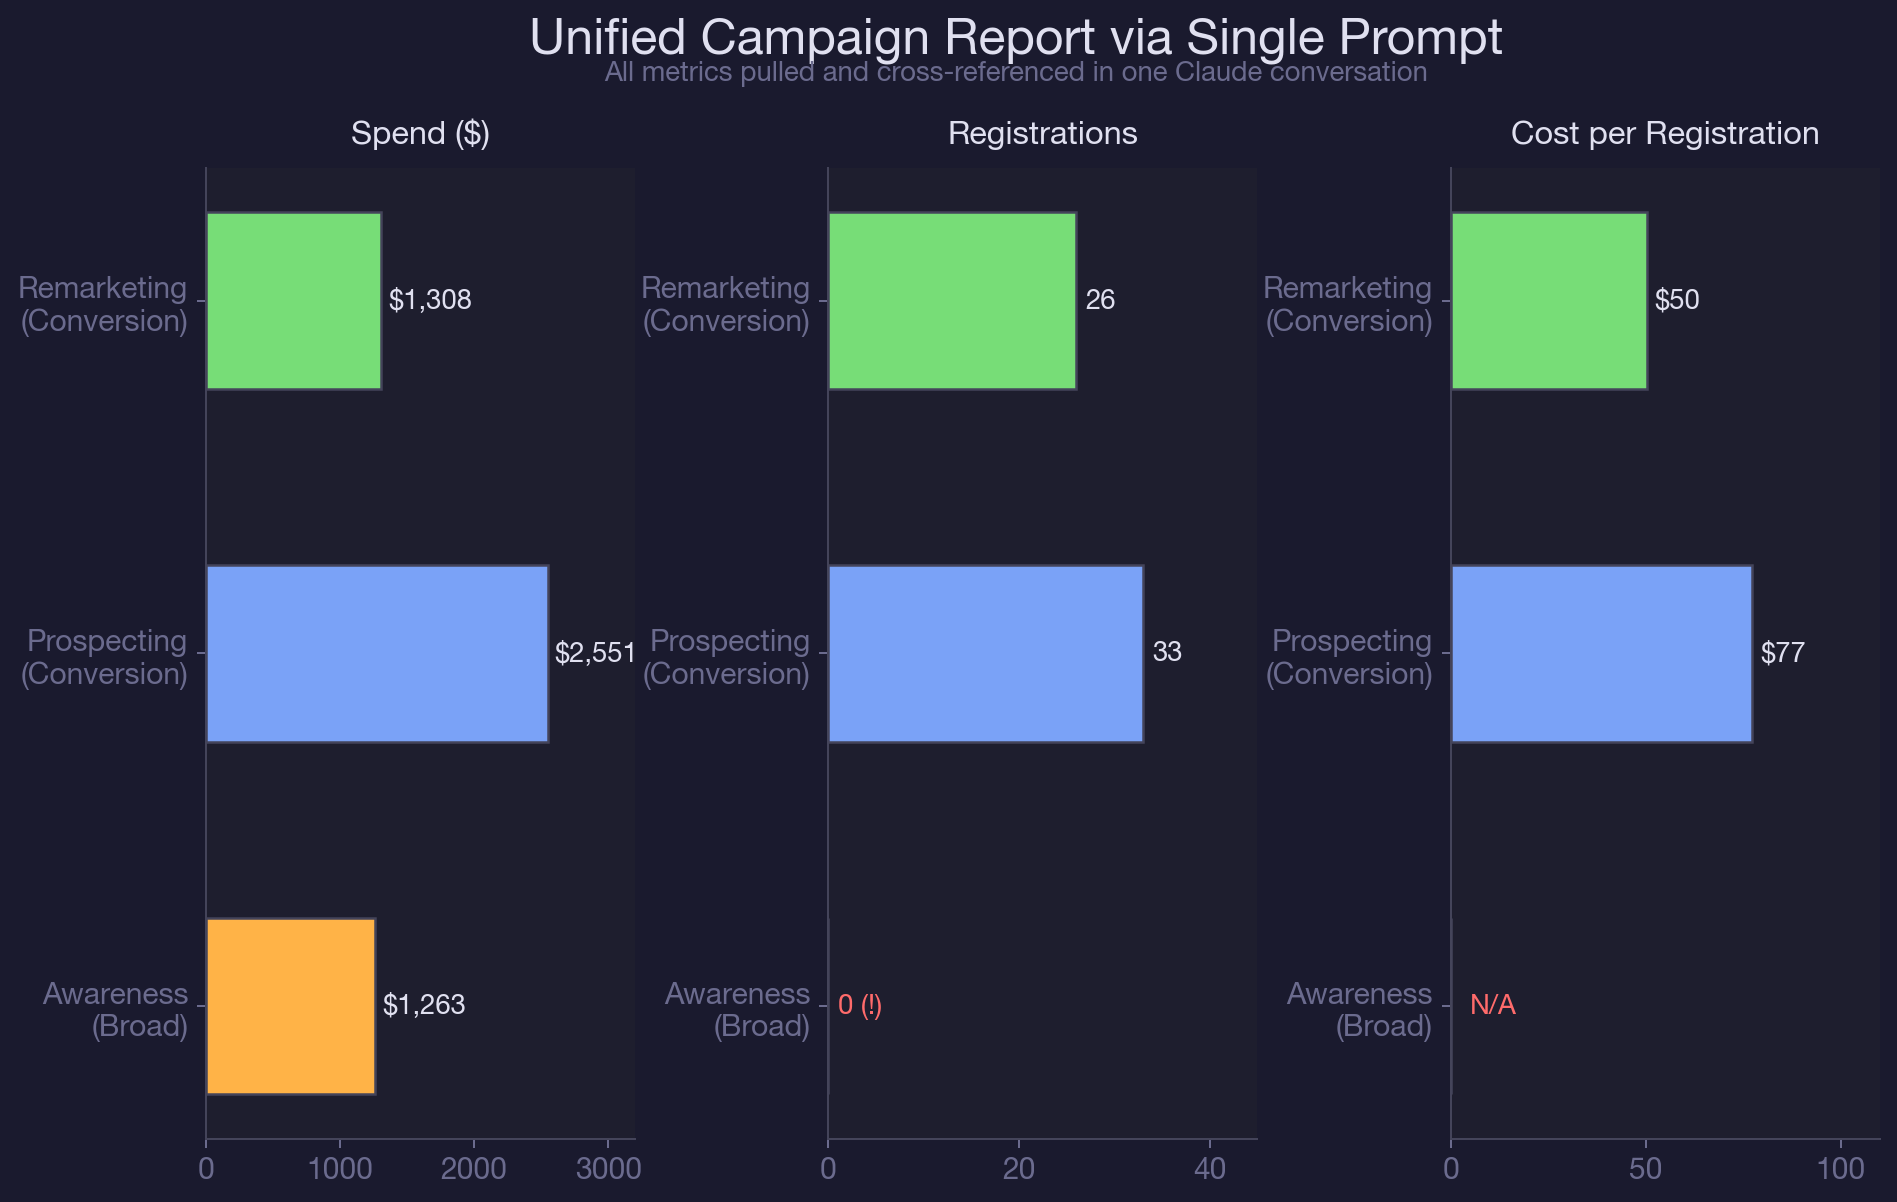
Claude also flags the awareness campaign's zero-registration output alongside its $1,263 spend. In a standard Ads Manager export, that campaign looks fine because it met its reach goal. In Claude's cross-referenced view, it is immediately visible as spend with no conversion path.
Step 3: Add Platform and Device Breakdown (2 minutes)
Prompt: "Break down the last 30 days of performance by device platform for each campaign. Show me the split between mobile and desktop for impressions, clicks, and cost per registration."
Claude calls get_insights(breakdown=device_platform). This answers the stakeholder question that always comes up in reporting meetings: "Where are our registrations coming from, mobile or desktop?" Instead of creating a separate pivot table, Claude adds the device breakdown to the existing report context. In B2B SaaS accounts, desktop conversions typically cost less than mobile, and seeing that split helps justify bid adjustments. For more on how Advantage+ campaigns handle device targeting automatically, check our deep dive on decoding Meta's black-box optimization.
Step 4: Cross-Reference and Flag Issues (3 minutes)
Prompt: "Based on all the data you have pulled, identify the top issues in this account ranked by spend impact. For each issue, explain why it matters and what I should do about it."
This is the step that separates AI-powered reporting from raw data exports. Claude synthesizes campaign structure, ad set performance, targeting configs, and device breakdowns into a prioritized issue list. In our test account, Claude flagged six issues that a manual report would have missed or buried:
- Awareness campaign spending $1,263/month with no conversion tracking. Impact: $1,263 in unattributed spend. Fix: add registration pixel event or reallocate budget to conversion campaigns.
- Lookalike ad set CPR ($90.17) is 79% higher than retargeting ($50.31). Impact: $517 in excess spend over 30 days. Fix: test narrower lookalike seed or reduce daily budget until CPR aligns.
- Interest-based ad set shares four targeting categories with the broad awareness ad set. Impact: audience overlap driving up frequency and CPM across both. Fix: exclude overlapping interests from the awareness campaign or consolidate into a single ad set.
- Combined frequency across ad sets exceeds 3.5x for shared audience segments. Impact: ad fatigue and declining CTR. Fix: implement frequency caps at the campaign level.
- No cost-cap bidding on conversion campaigns. Impact: CPR volatility. Fix: set cost-cap bids based on target CPR of $60 to prevent overspend during high-competition periods.
- 100% of budget allocation is evenly split across ad sets regardless of performance. Impact: best-performing ad set (retargeting) is underfunded relative to its efficiency. Fix: shift 40% of lookalike budget to retargeting.
A manual audit catches one or two of these. Maybe three if the analyst is thorough. Claude catches all six because it holds the full dataset in context and cross-references metrics that live in different parts of the Ads Manager UI. This is the same principle behind the budget pacing analysis: spotting spend anomalies before they compound into wasted budget.
Step 5: Generate the Report (3 minutes)
Prompt: "Format everything into an executive summary. Include: total spend, total registrations, blended CPR, top-performing ad set, biggest risk, and three recommended actions. Keep it under 400 words."
Claude compiles the entire analysis into a formatted summary that is ready to drop into Slack, email, or a stakeholder deck. No CSV merging. No pivot tables. No formatting. The output includes:
- Account snapshot: $5,123 total spend, 59 registrations, $86.83 blended CPR
- Top performer: Retargeting ad set, 44% of registrations on 26% of budget
- Biggest risk: $1,263 awareness spend with no conversion tracking
- Three prioritized actions with expected impact
Total time from first prompt to final report: 12 minutes. The manual equivalent: 3.5 hours.
Real-World MCP Walkthrough: Multi-Account Reporting
The five-step workflow above works for a single account. For agencies and in-house teams managing multiple accounts, the real power of Claude and MCP is running the same sequence across accounts and comparing the outputs.
We tested this with two Meta Ads accounts: a primary US-focused B2B SaaS account and a secondary India-focused account used for event promotion. The primary account had three active campaigns with $5,123 in 30-day spend. The secondary account had paused campaigns from a recent GTM meetup push.
Here is what Claude's cross-account report surfaced that individual account reports would have missed:
- The primary account's lookalike ad set used a 1% seed built from purchasers. The interest-based ad set in the same account targeted overlapping job titles and SaaS interests. When Claude compared the targeting configs side by side, it flagged that four of six interest categories were shared between the lookalike seed characteristics and the interest targeting. That overlap was invisible in single-campaign reporting.
- The secondary account's event campaigns were paused but still had active custom audiences consuming pixel bandwidth. Claude flagged these as cleanup candidates, since stale audiences inflate audience pool sizes and can skew lookalike quality in the primary account if both accounts share the same Business Manager.
For agencies running multiple Meta Ads accounts through Claude, this cross-account synthesis is the difference between producing ten isolated reports and producing one unified analysis that catches systemic issues. The spy-on-competitors workflow for Facebook ads adds another layer: benchmarking your reporting data against competitive creative trends.
The prompt sequence is identical. You just run it twice, once per account, and then ask Claude to compare the outputs. The cross-referencing that would take a human analyst half a day happens in the same conversation window, with full context from both accounts.
Common Reporting Mistakes That AI Helps You Avoid
1. Reporting campaign-level metrics instead of ad-set-level metrics
Campaign-level CPR averages together ad sets with wildly different performance. Your blended $86.83 CPR hides the fact that retargeting is at $50.31 and lookalikes are at $90.17. Claude's default output breaks performance down to the ad set level, where the real decisions happen. If you are only reporting at the campaign level, you are making optimization decisions with blurry data.
2. Ignoring conversion-objective mismatches
An awareness campaign optimized for reach can spend thousands per month and look perfectly healthy in the Ads Manager summary. It hit its reach target. Its CPM is low. But it has zero conversion events attached, so none of that spend contributes to pipeline. Claude flags this automatically because it compares campaign objectives against registration and purchase events. Manual reports often skip this check because the campaign "is not supposed to convert" by design.
3. Building reports from static exports instead of live data
CSV exports are snapshots. By the time you merge, calculate, and format them, the data is hours or days old. Claude pulls live data via MCP at the moment you ask. For B2B SaaS companies running Facebook ads, where lead quality matters more than lead volume, stale data means stale decisions. A lookalike ad set that crossed your CPR threshold yesterday will not show up in a report built from last Thursday's export.
4. Treating frequency as a single-ad-set metric
Frequency is reported per ad set, but audiences do not belong to a single ad set. If three ad sets share 25% audience overlap, the real frequency for that shared segment is the sum of individual frequencies, not the average. Claude calculates compound frequency when it detects targeting overlap, which is why the audience overlap analysis is a prerequisite for accurate reporting. Manual reports almost never account for cross-ad-set frequency stacking.
Best Practices for AI-Powered Meta Ads Reporting
- Run the five-step prompt sequence weekly on Mondays. Save the prompt as a template so you can reuse it across accounts without rewriting. The same sequence works for any account with active campaigns.
For teams using the weekly budget recommendation workflow, chain it after the reporting prompt. Claude already has your performance data in context, so the budget recommendation uses real numbers instead of assumptions.
- Set a CPR threshold before you start. Tell Claude your target CPR in the first prompt (e.g., "Our target CPR is $60"). Claude will flag any ad set exceeding that threshold and calculate the excess spend. Without a threshold, Claude reports numbers without judgment.
- Always request the ad-set-level breakdown, not campaign-level. Campaign-level metrics average out the signal you need. Tell Claude to break every metric down by ad set, even if your stakeholder report will summarize at the campaign level. You need the ad-set view to make optimization decisions; the campaign view is just for the executive summary.
- Include a "compared to last period" request. Add "Compare these numbers to the previous 30 days" to your prompt. Claude will calculate period-over-period changes in spend, registrations, CPR, and frequency. That trend context is what separates a status report from an insight report.
Pair Meta Ads reporting with Google Ads audit workflows if you run both channels. Claude can hold both datasets in context and compare cross-channel CPR, so you know where your next dollar should go.
Conclusion
Meta Ads reporting should not take longer than the analysis it informs. The five-step prompt sequence in this article replaces CSV exports, spreadsheet merges, and manual cross-referencing with a single Claude conversation that produces a stakeholder-ready report in 12 minutes. More importantly, it catches issues that manual reports miss: conversion-objective mismatches, cross-ad-set frequency stacking, and budget allocation drift.
The reporting workflow compounds with every other analysis you run in Claude. If you have already audited your account structure or analyzed audience overlap, the reporting prompt builds on that context. Each new prompt makes the next one smarter.
Dashboard juggling is the first thing we eliminate when onboarding a new Meta Ads account. We use Claude and the Meta Ads MCP to build unified reporting dashboards in minutes as part of our B2B SaaS paid social management. If you want us to set up this reporting workflow on your account, book a call with our paid media team.
Frequently Asked Questions
What is AI Meta Ads reporting?
AI Meta Ads reporting uses Claude and the Meta Ads MCP connector to pull campaign data, ad set performance, and targeting configs through API calls, then synthesize them into a unified report. Instead of exporting CSVs and building spreadsheets manually, you get a cross-referenced analysis from a single conversation.
How long does it take to generate a Meta Ads report with Claude?
The full five-step reporting workflow takes about 12 minutes for a three-campaign account. That covers pulling campaign structure, ad set performance, device breakdowns, issue flagging, and generating an executive summary. The manual equivalent takes 3.5 hours for the same account.
Can Claude pull data from multiple Meta Ads accounts in one session?
Yes. You run the same prompt sequence for each account, and Claude holds both datasets in context. It can then compare cross-account metrics like CPR, frequency, and budget allocation. This is especially useful for agencies managing multiple client accounts through the same Business Manager.
How often should I run AI Meta Ads reporting?
Weekly is the minimum cadence for active accounts. Run the reporting prompt every Monday to catch performance shifts before they compound. For high-spend accounts (over $10,000/month), consider running a shortened version daily that focuses on spend, registrations, and CPR without the full device breakdown.
What is the difference between AI Meta Ads reporting and Ads Manager's built-in reports?
Ads Manager reports show metrics within individual views: campaign-level, ad-set-level, or ad-level. They do not cross-reference targeting configs with performance data or calculate compound frequency across overlapping ad sets. Claude pulls all three data layers through MCP and analyzes them together, catching issues like conversion-objective mismatches and budget allocation drift that single-view reports miss.
How do I fix a Meta Ads account where awareness campaigns have no conversion tracking?
Add a conversion pixel event (registration, purchase, or lead) to the awareness campaign, or reallocate its budget to your conversion-optimized campaigns. Claude flags this issue automatically when it compares campaign objectives against action events. In our test account, an awareness campaign was spending $1,263/month with zero registrations because it was optimized for reach instead of conversions.
Can Claude generate Meta Ads reports without API access?
Claude needs the Meta Ads MCP connector to pull live data via API. Without MCP, you can paste exported data into Claude for analysis, but you lose the live-data advantage and the ability to drill into ad set details or device breakdowns on demand. The MCP integration is what makes the 12-minute workflow possible.
What metrics should I include in a weekly Meta Ads performance report?
At the ad set level: spend, impressions, reach, frequency, link clicks, landing page views, registrations, and cost per registration. At the campaign level: total spend, blended CPR, and objective alignment. Add device breakdown (mobile vs. desktop) and period-over-period comparison for trend context. Claude pulls all of these through three MCP calls.

summarize with ai


