.png)


Key Takeaways
- Monthly reporting used to eat a full analyst day per client. Claude Code compressed it to about 30 minutes of draft work plus review. The hours saved are real; the quality gain is larger.
- We pull GSC performance, GA4 landing-page data, and AI citation data into a Claude Code project folder. The filesystem MCP reads every file; no copy-paste, no spreadsheet staging.
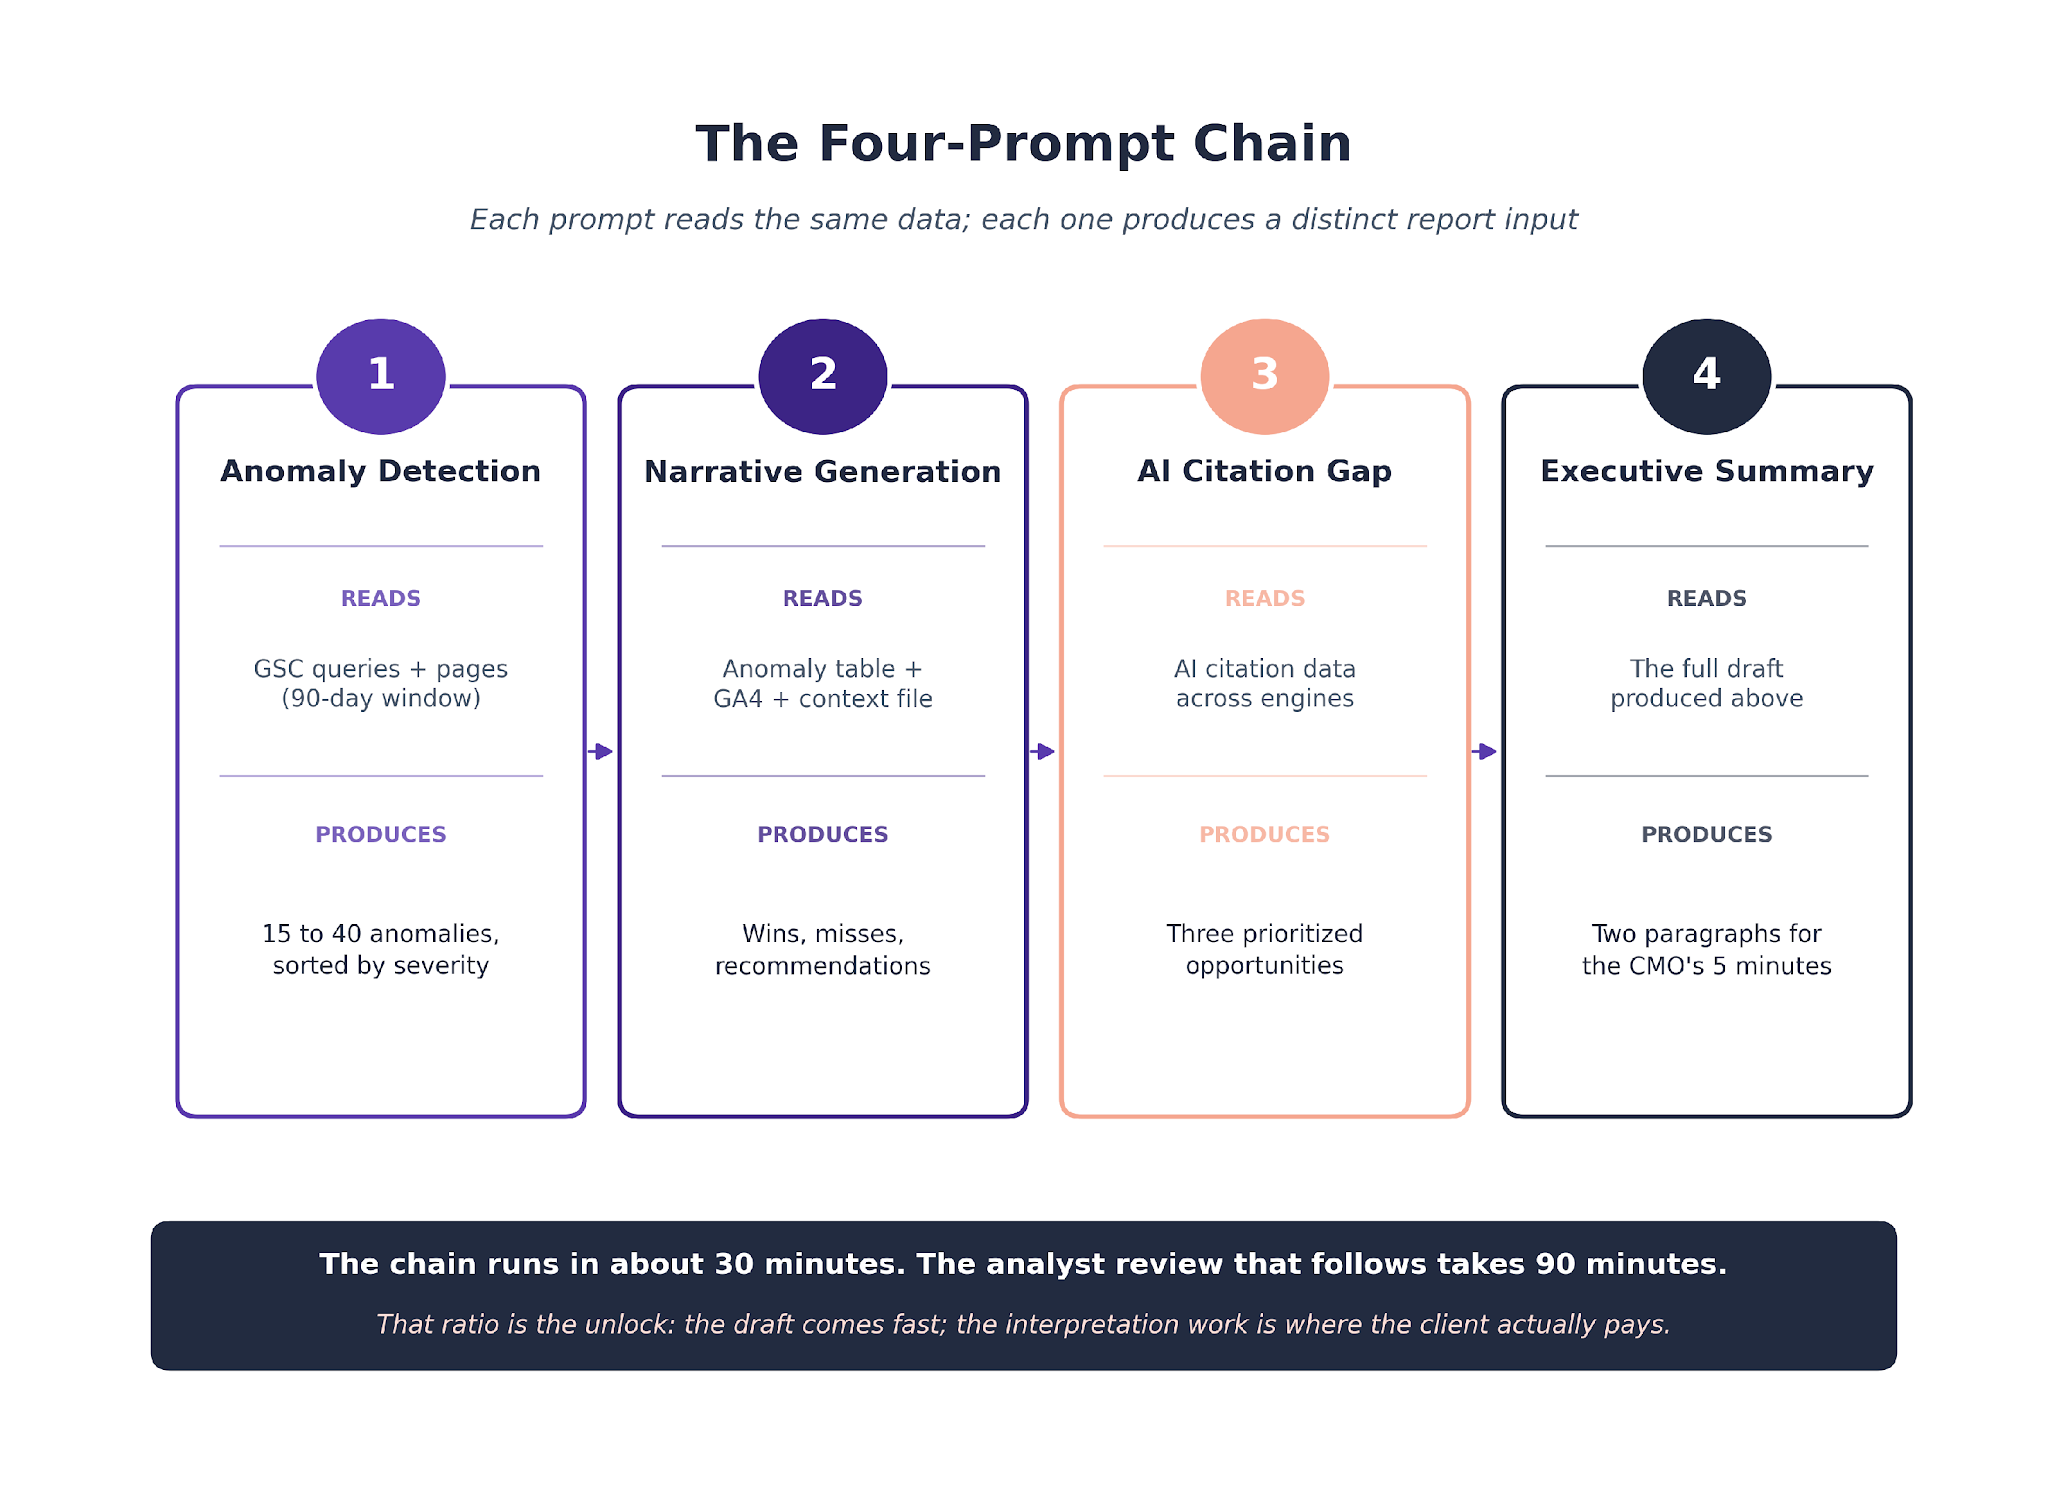
- Four prompts carry the work. Anomaly detection, narrative generation, AI citation gap analysis, and the executive-summary pass. Each one runs against the same data set.
- The report ships a narrative, not a dashboard. Three wins, three misses, two recommendations, one emerging opportunity. Every section backed by a specific URL and a specific number.
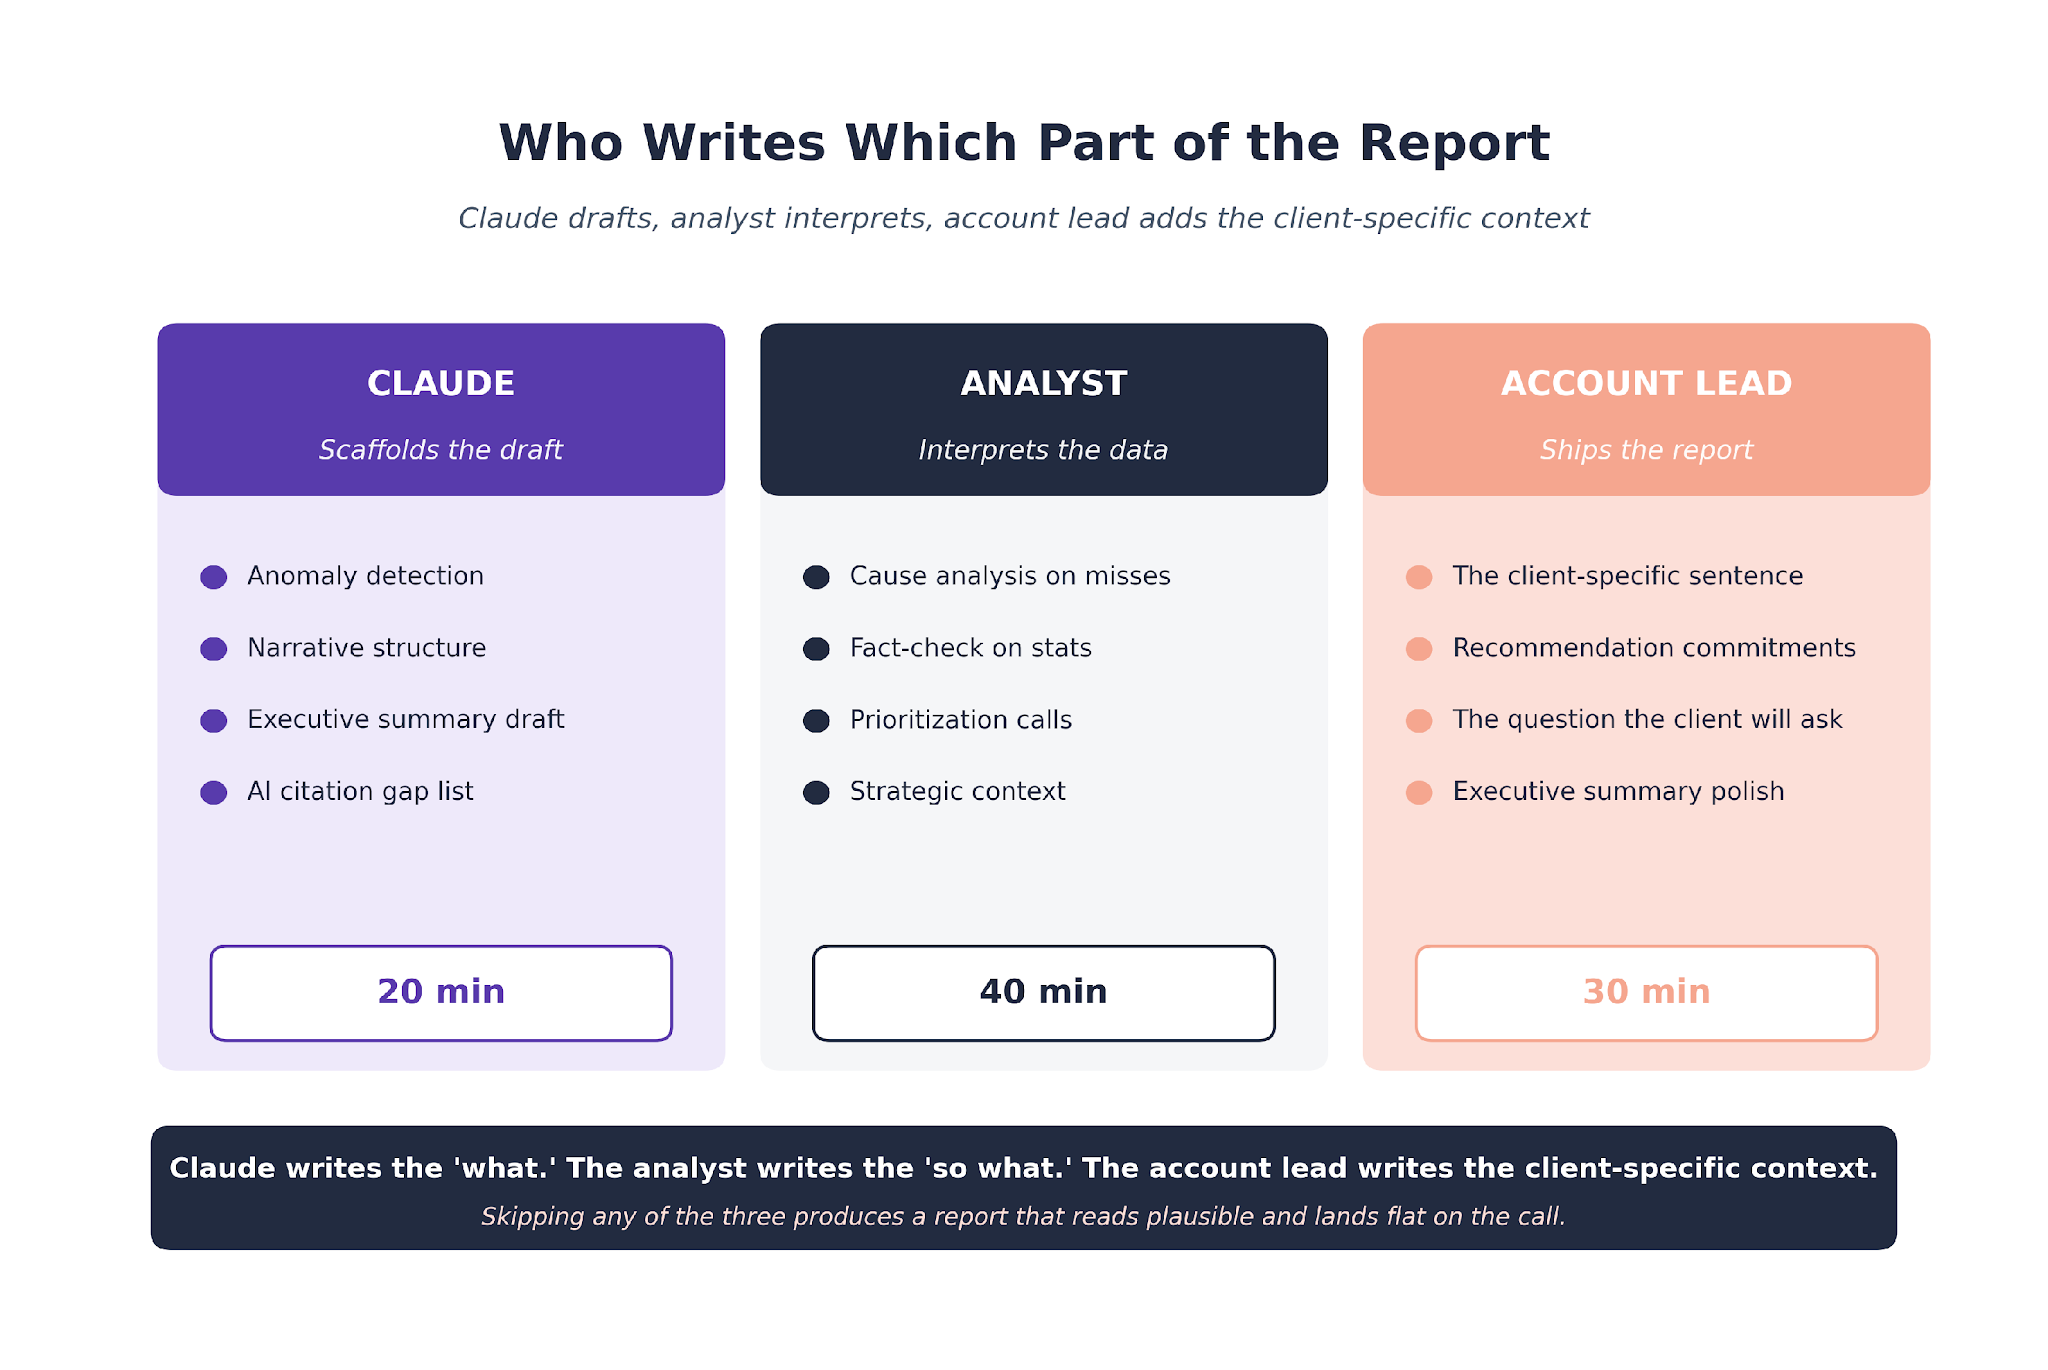
- The interpretation layer stays human. Claude writes the "what." The account lead writes the "so what" that the client reads on the call.
- Clients who see AI citation visibility reported alongside traditional search metrics engage differently with the report. The two-system reality changes which questions get asked on the call.
What the Client Is Reading in the Report
The account lead opens the monthly report deck on the client call. Slide two is a traffic chart. Slide three is a keyword movement table. The CMO asks one question, and the answer is not on any slide.
"Why did queries about data integrity drop off last month?"
The old version of this workflow had no answer to that question. The analyst had spent the day pulling GSC data and formatting slides. There was no time left to read the data carefully enough to anticipate the CMO's actual question.
The new version of the workflow starts with the question. Claude reads the GSC and GA4 exports, surfaces anomalies, drafts the narrative, and leaves the analyst 90 minutes of interpretation time for every hour that used to be spent on data pulls.
This article walks the exact pipeline. The data sources, the prompt chain that extracts insights, the report template, the adaptations per client vertical, and the three human-only steps we will not remove.
The broader stack this sits inside is covered in our Claude SEO guide. This piece is the reporting layer.
The Data Pipeline
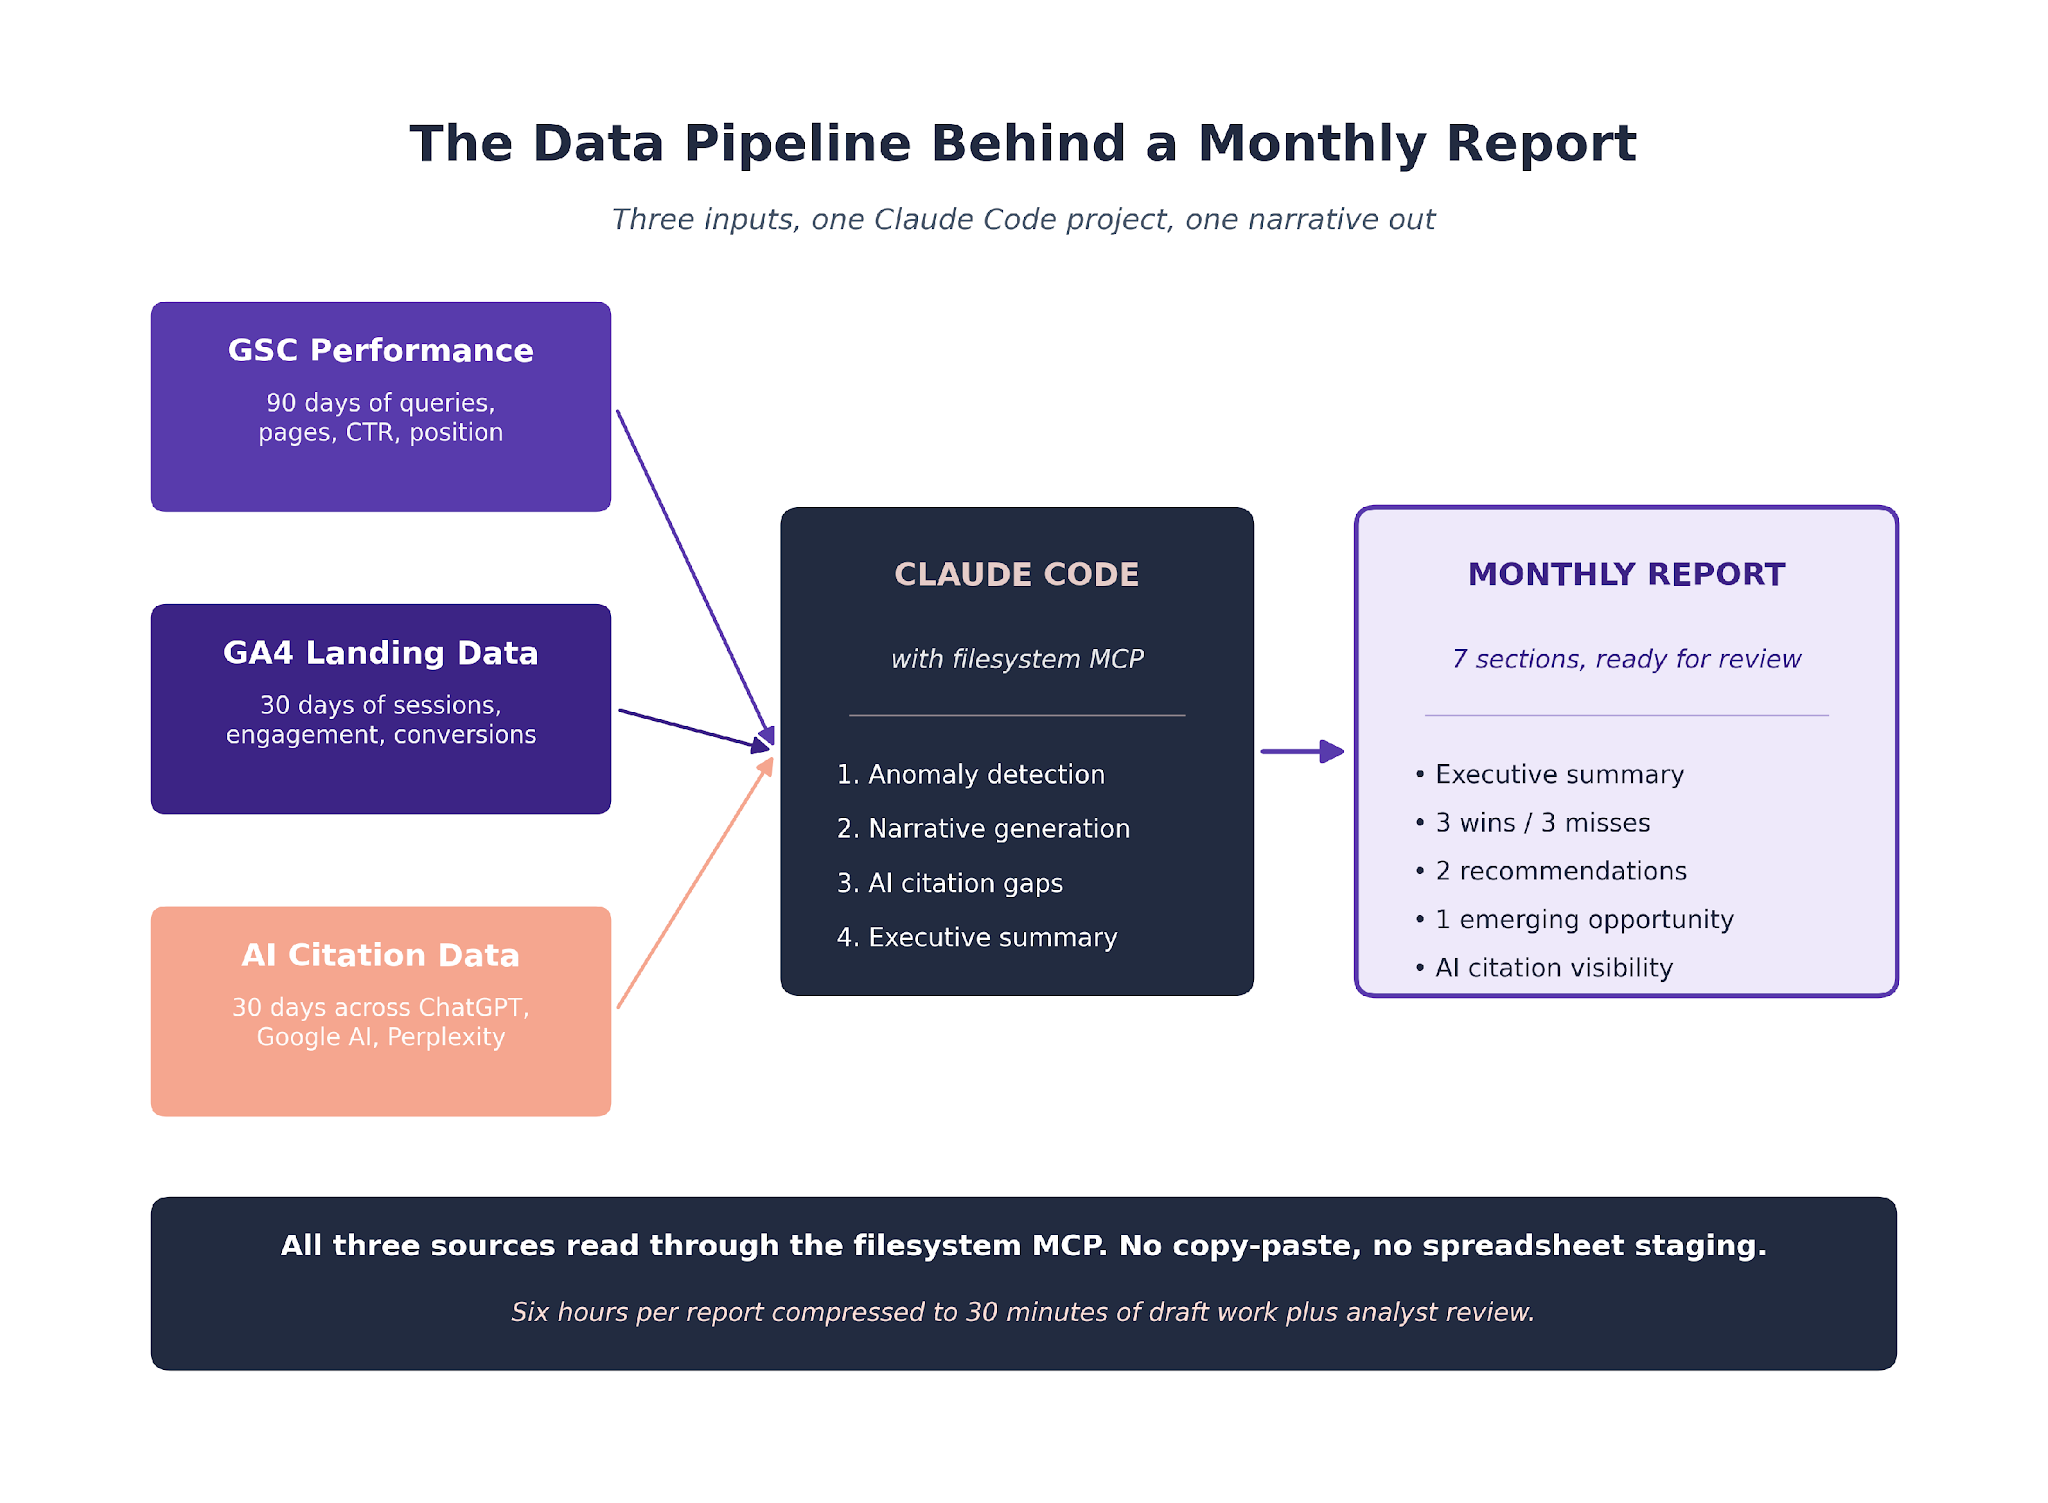
The reporting pipeline reads three data sources for every client. The file formats are standardized; the data stays on our filesystem and Claude Code reads it through the MCP.
GSC Performance Export
Every report pulls 90 days of GSC data per client. Query-level impressions, clicks, average position, CTR. Page-level the same metrics. Device breakdown. Country breakdown when the client has multi-geo targeting.
The export is a folder of CSVs that sits in the client's project directory. Claude reads the files by expected names: gsc-queries.csv, gsc-pages.csv, gsc-devices.csv, gsc-countries.csv.
GA4 Landing Page Data
GA4 contributes the behavioral layer. Sessions, engaged sessions, engagement time, conversion events, and landing-page traffic by organic source.
Claude reads ga4-landing.csv (sessions and conversions per landing page) and ga4-events.csv (conversion event volume per page). The pairing with GSC is what lets Claude distinguish between impression changes and conversion changes.
AI Citation Data
The third source is AI citation visibility. We track which pages earn citations in ChatGPT, Google AI Mode, Google AI Overview, and Perplexity for target queries. That data sits in ai-citations.csv with the query, the platform, the citing URL, and the citation date.
This is the layer that changed our monthly report the most. Pre-AI-tracking, we reported on traditional search only. Post-AI-tracking, we report on the two-system reality: traditional rankings plus AI citation share across the engines clients care about.
The CLAUDE.md That Ships With Every Client
# CLAUDE.md for Monthly Reporting (Client: [Company])
## Data sources
- ./gsc-queries.csv (90d query performance)
- ./gsc-pages.csv (90d page performance)
- ./ga4-landing.csv (30d sessions + conversions)
- ./ai-citations.csv (30d AI citation data)
- ./client-context.md (client business context)
## Output expected
- Three wins narrative, three misses narrative
- Two recommendations for next month
- One emerging opportunity
- Every claim backed by a specific URL and number
## Guardrails
- Do not invent ranking changes or conversion numbers
- Every stat cited must trace to a specific CSV row
- Flag anomalies as HIGH/MED/LOW severity
- Cross-reference GSC clicks against GA4 conversions before prioritizing
- Never write "the brand is crushing it" style copy
The guardrails are what keep the report defensible. Every number in the client-facing copy traces back to a CSV row Claude can name. The account lead verifies the traceability before the report ships.
The Four Prompts That Do the Work
Four prompts run in sequence. Each has a narrow job.
Prompt One. Anomaly Detection
Read gsc-queries.csv and gsc-pages.csv (90-day window).
Find every anomaly worth client attention:
- queries with 50%+ impression drop week-over-week
- queries with rising impressions but flat clicks (CTR opportunity)
- queries moving from position 4-10 to 11-20 across the period
- new queries entering the top 20 for the first time
- queries that were ranking that now do not appear in the top 100
For each anomaly: query, baseline metric, current metric,
suspected cause, recommended next step, severity (HIGH/MED/LOW).
Sort by severity desc, then by traffic potential desc.
Return a table.
A typical 90-day window surfaces 15 to 40 anomalies. The account lead spot-checks and the top five to eight become the basis of the report.
Prompt Two. Narrative Generation
Write the client-facing narrative for this month's report.
Context: the anomaly table above, the GA4 conversion data, and
the client business context in client-context.md.
Structure:
- Top three wins (one sentence each, with URL and number)
- Top three misses (one sentence each, with URL and number)
- Two recommendations for next month (what we will do, with reasoning)
- One emerging opportunity (something the data hints at that we are
not yet acting on)
Tone: confident but not overselling. Numbers front and center.
Every claim carries a specific URL or query.
The draft comes back in two to three minutes. The account lead spends 20 to 30 minutes tightening language, adding client-specific context, and adjusting recommendations.
Prompt Three. AI Citation Gap Analysis
Read ai-citations.csv.
For the queries the client tracks:
- where is the client cited (platform + page)
- where is the client absent that they should be cited
- which competitor domains capture citations on topics the client ranks for
- queries where AI engines cite but Google does not rank the client
Return three prioritized opportunities for the next month.
This is the prompt that changed what the monthly report looks like. AI citation data did not exist in reports two years ago. It now anchors one full section.
Prompt Four. Executive Summary
Write a two-paragraph executive summary.
Audience: CMO or Head of Marketing with 5 minutes.
Lead with the single most important movement this month.
Reference the top win URL, the top miss URL, and the top recommendation.
Close with the question the client should ask on the next call.
This runs last, after the full report is drafted. It is what gets pasted into the email that goes with the deck. The account lead tightens it, the account lead ships it.
What Our Reporting Data Shows
Across the B2B SaaS monthly reports we ship, the four-prompt chain produces drafts that pass account-lead review with roughly one round of edits on 80% of reports. The reports that need more work are the ones where the client business context changed mid-month and the CLAUDE.md did not get updated in time. The context file is the single biggest quality driver.
What the Monthly Report Looks Like End to End
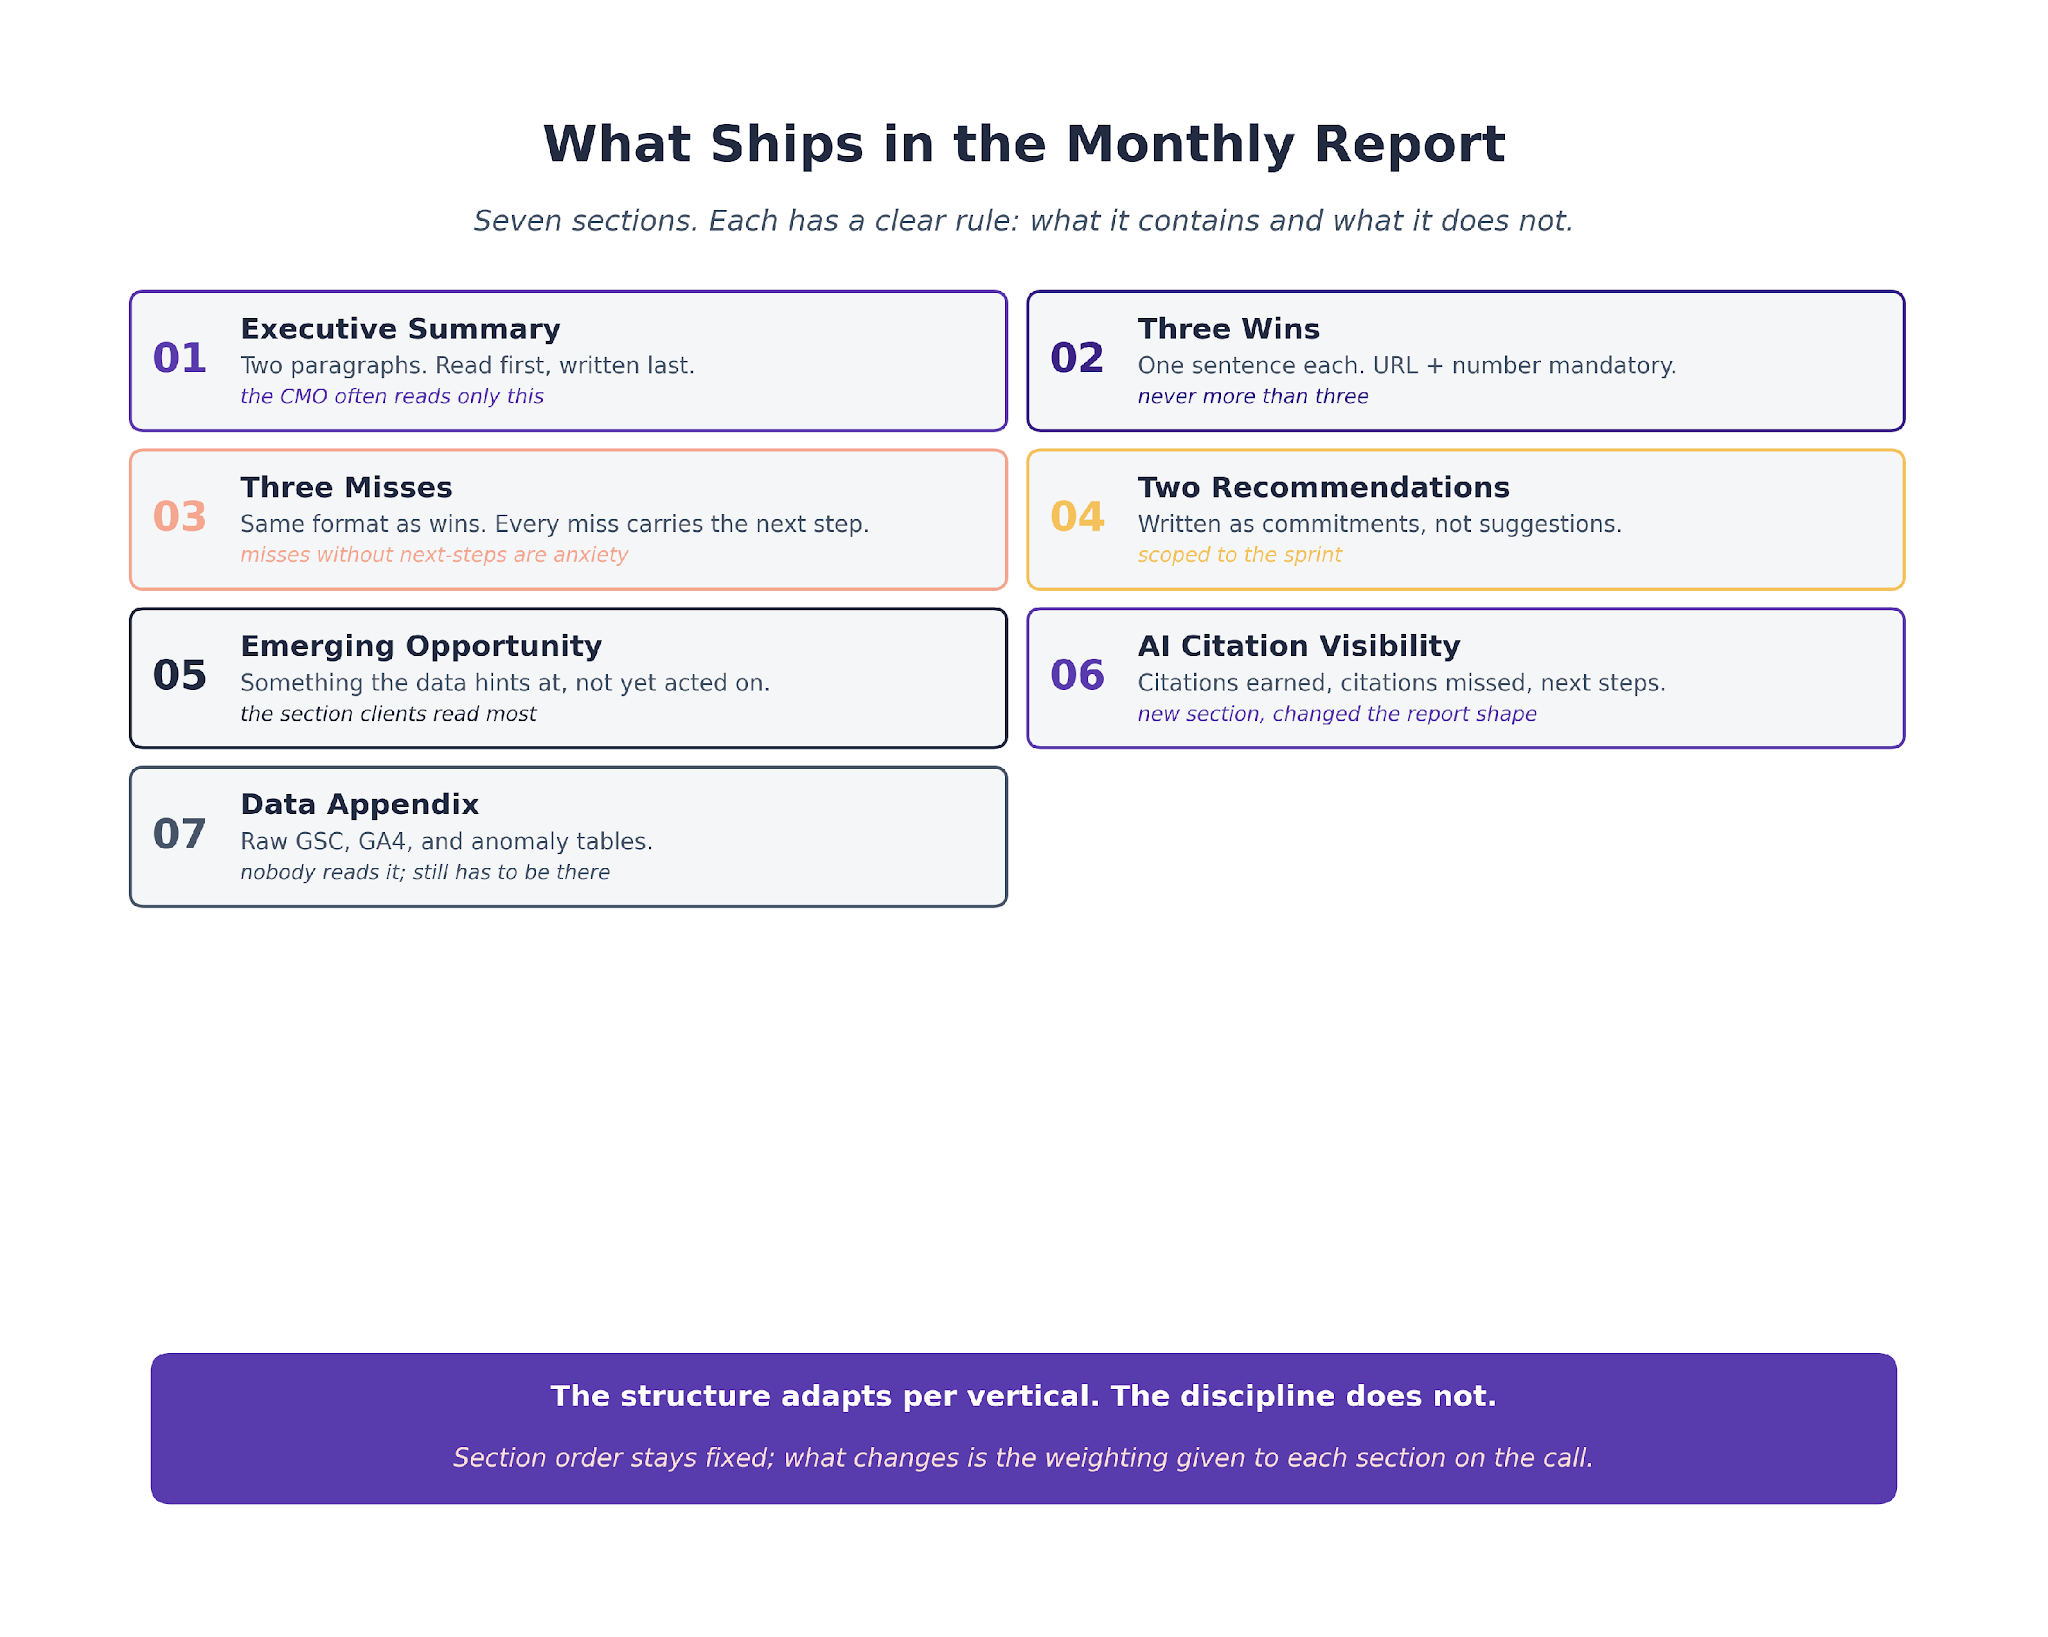
The deliverable is consistent across engagements. The layers adapt to client vertical; the structure does not.
Section One. Executive Summary
Two paragraphs. Written last, shipped first in the deck and in the email body. The CMO reads this and nothing else in a third of cases.
Section Two. Three Wins
Each win gets one sentence, one URL, one number. "The /pricing-comparison/ page moved from position 14 to position 6 for 'sales enablement platform comparison' and is now driving 2,200 sessions a month in organic."
Three is the cap. Five wins makes the report read defensive; one win makes it look like nothing moved.
Section Three. Three Misses
Same format as wins. Same cap. "Queries about data integrity dropped 34% in impressions week-over-week after competitor XYZ published their guide; we are shipping a refresh of /data-integrity-saas/ next week."
The miss always carries the next step. Misses without next steps are anxiety, not insight.
Section Four. Two Recommendations
Recommendations are written as commitments, not suggestions. "We are generating Article schema for the 40 blog archive pages missing it by end of week." Not "we suggest considering generating schema."
Section Five. One Emerging Opportunity
The emerging opportunity is the section clients tell us they read most carefully. It is where we surface something the data hints at that we have not yet acted on.
Section Six. AI Citation Visibility
The newest section. Three subsections: where the client is cited, where they should be cited but are not, and what we are doing about the gap next month.
Section Seven. Data Appendix
GSC performance, GA4 conversion volume, ranking changes, and the raw anomaly table. Nobody reads this section. It exists because the one time someone asks a question it answers, it needs to be there.
Three Adaptations We Make Per Vertical
The template adapts. The adaptations are small but they change whether the report lands.
Enterprise B2B SaaS Clients
Longer ranking horizons, lower volume, higher ACV. The report weights the Emerging Opportunity section harder because strategic changes move outcomes more than quarterly ranking fluctuations.
Our enterprise SEO metrics framework covers the ranking-horizon logic we use.
PLG Developer Tools
Higher volume, shorter buying cycle, documentation-driven organic. The report weights ranking changes on technical keywords and includes a separate section on code-snippet visibility in SERPs.
AI citation tracking weights Perplexity higher because developers use Perplexity more than the general audience.
Mid-Market Horizontal SaaS
Most of our reporting falls here. The template ships unchanged. The executive summary gets one sentence of context about the client's current product launch, GTM moment, or competitive situation that the analyst pulls from the monthly check-in notes.
Three Sections We Never Let Claude Close Alone
Three parts of the report stay human. The line is deliberate.
The Interpretation Layer
Claude writes "impressions on /integrations/ pages dropped 23% week-over-week."
The account lead decides whether that is because Google is indexing fewer of them (technical issue), the client paused a competitor comparison page (strategic issue), or a seasonal pattern (business as usual).
The interpretation is what the client is paying for. Claude does not know which of the three explanations fits. The account lead does.
The Recommendation Layer
Claude can produce plausible next-step recommendations. It cannot know which recommendation the client's engineering team has the bandwidth to ship this sprint.
The account lead selects the recommendation, scopes it to what is truly shippable this sprint, and commits TripleDart to the work in writing. That commitment is what keeps the report from becoming a wishlist.
The Client-Specific Call
Every client has one question that weighs on them most this month. A product launch, an investor update, a new competitor, a pricing change. The account lead writes one sentence addressing that context directly.
Claude cannot produce it because Claude does not sit on the client's quarterly check-in calls. The account lead does.
What Our Report Review Data Shows
Account leads spend about 30 minutes per report on the human-only sections on average. The interpretation layer takes the longest. The client-specific callout is the shortest but carries the most weight on the actual call. Shipping a report with weak interpretation is the single most common reason clients disengage from the monthly cycle.
Why the Report Is the Conversation Before the Call
The monthly report is not a document. It is the preparation for a 30-minute call with a CMO or Head of Growth who wants to know one thing: is the SEO program producing what we said it would produce.
The report that answers that question cleanly gets the client engaged.
The report that hedges, buries the miss, or oversells the win gets the client disengaged. Both patterns build over months; clients who disengage stop fighting for budget the next quarter, and budget cuts hit SEO before most other channels.
The Misses Tell You More Than the Wins
A report that is all wins reads like a sales deck. A report that names three misses, with specific URLs and specific next steps, reads like an agency that knows what it is doing.
Our monthly reporting practice weights the Miss section for exactly this reason. Missing a ranking target on a specific page is normal. Not having a next-step for it is not. Every miss that ships to a client carries a commitment attached.
The Emerging Opportunity Is Where Trust Builds
The Emerging Opportunity section is the one clients tell us they read most carefully. It is the section where we surface something the data hints at that has not yet been acted on.
This could be a cluster of queries showing rising impressions that the content calendar has not picked up. A new competitor showing up in AI citations. A technical pattern in the crawl data that suggests a template fix.
The section exists to keep the client's SEO work ahead of the obvious.
How Reporting Feeds the Next Month's Work
The monthly report is not the end of the cycle. It is the input to the next month's planning.
The three wins become the candidate list for feature expansion. The three misses become priority targets for content refresh or technical audit work. The two recommendations become explicit deliverables for the next month.
The AI citation gaps feed the content calendar covered in our keyword research pipeline. The technical anomalies feed the audit workflow in our technical audit guide.
The schema coverage notes feed our schema generation workflow for template-level deployment.
The reporting layer is where the full stack connects.
The First Month vs. the Ongoing Cadence
The first month running this pipeline takes longer than the subsequent months. The CLAUDE.md has to be built, the client business context file has to be populated, and the analyst has to calibrate against the anomaly detection output.
We budget three to four hours for the first month's report on a new client. That drops to 90 minutes to two hours by the third month, once the CLAUDE.md and the reviewer cadence stabilize.
Post-stabilization, the reporting time is where SEO programs get their capacity back.
A senior analyst covering four clients used to spend two full days a month on reports. That same analyst now spends one afternoon.
The recovered hours go into the parts of the engagement that Claude cannot touch: client strategy calls, sprint planning with engineering, and the interpretation work that makes the reports sharp.
The Reviewer Cadence We Never Cut
Every report gets two human pass-throughs before ship. The first is the draft review by the strategist who worked on the client that month. The second is the account-lead review by the person who will present the report on the call.
The two passes catch different things. The strategist review catches data errors and missed context. The account-lead review catches framing problems and prioritization gaps. Skipping either produces a report that reads fine but lands flat.
Putting the Reporting Workflow Into Practice
Monthly reporting is the stage where most SEO teams lose analyst hours to mechanical work the data could surface automatically. Fixing it is cheap. The pipeline above takes one afternoon to set up for a single client.
The right entry point is a single report run against the most recent month of GSC and GA4 data. Compare what the pipeline surfaces to what your analyst wrote manually.
The delta, whether it is in the anomaly list, the AI citation section, or the recommendation quality, is the evaluation.
We run this reporting workflow across 250+ B2B SaaS engagements at TripleDart. The pattern carries across WeWork, Atlas, Payoneer, and SignEasy, with client-vertical adaptations that stay lightweight to maintain.
The broader SEO strategy frame this reporting sits inside is covered in our SaaS SEO strategy guide.
For the analytics infrastructure side, our marketing analytics hub covers the GSC and GA4 setup the pipeline reads from.
The Search Engine Land coverage of Claude Code as an SEO command center frames the data-pipeline side of this work from a slightly different angle. We ship the same pattern with a monthly cadence.
If your reports take more than half an analyst day per client to produce, the reporting layer is where you are leaving the most on the table. Talk to our team to see how we would set it up for your engagements.
Frequently Asked Questions
Can Claude replace an SEO analyst for reporting?
No. Claude drafts the narrative. The interpretation, the recommendation, and the client-specific context stay with the analyst. Teams that remove the analyst layer produce reports that read plausible and miss the questions the client carries into the call.
Which Claude model works best for reporting?
Claude Opus for narrative generation and executive summary. Claude Sonnet handles the anomaly detection and the data-pull stages fine. For full pipeline consistency, we default to Opus. The Anthropic model overview covers the tier differences.
How much time does the pipeline save per client?
About six hours per report, on average. A 30-minute draft run plus 90 minutes of account-lead review, compared to a full day of analyst pull-plus-write work before the pipeline existed.
How do you stop Claude from inventing numbers in the narrative?
The CLAUDE.md explicitly prohibits numeric invention. Every stat cited in the narrative has to trace to a specific CSV row. The account lead verifies two or three stats per report before shipping. Claude still occasionally drifts; the verification catches it.
Does the pipeline handle clients across different GSC geographies?
Yes. We export GSC data per geography and let Claude reason across the segments. The report includes a per-geo breakdown when the client has traffic above a threshold in more than one market.
How do AI citations show up in the report?
A dedicated section (section six) covers citation visibility on ChatGPT, Google AI Mode, Google AI Overview, and Perplexity. The section tracks citation volume, which pages earn the citations, and where competitors capture citations we do not. The Ahrefs AI SEO statistics compilation covers the broader market data in more depth, and the HubSpot SEO trends research tracks the AI Overview impact across mixed verticals.
What happens when the data conflicts between GSC and GA4?
GSC wins for ranking and impression data. GA4 wins for conversion and engagement data. The report cross-references both before writing any cause-and-effect language; unexplained conflicts get flagged as "needs investigation" rather than speculated on.
Do you publish a template clients can use themselves?
The structure described above is the template. We have used variations of it across hundreds of B2B SaaS engagements. Copy the section structure, adapt to your vertical, and the main thing that takes work is the CLAUDE.md layer and the analyst-review discipline.
What happens on the call when a report surfaces a big miss?
The account lead leads with the miss. Burying it is the single fastest way to lose client trust. Every miss gets named, the root cause gets explained, and the next-step commitment is in writing before the call ends. That is the only pattern that keeps programs on track through a bad month; the pattern that loses clients is the one where the report hides the miss and the client finds it themselves three weeks later.
How do you handle a report where the data is thin?
Thin data, usually the first two months of a new engagement, changes the shape of the report rather than the discipline. Anomaly detection runs against a shorter baseline. The Emerging Opportunity section weights more heavily on competitor movement than on internal data. The reviewer cadence stays the same. Reports that are thin on data but disciplined on interpretation still earn client trust.



.webp)
.webp)

.png)


.png)




.webp)




.webp)

.webp)




%20(1).png)


.webp)
.webp)
.webp)



%20Ads%20for%20SaaS%202026_%20Types%2C%20Strategies%20%26%20Best%20Practices%20(1).webp)








.png)


.png)





.webp)


![Creating an Enterprise SaaS Marketing Strategy [Based on Industry Insights and Trends in 2026]](https://cdn.prod.website-files.com/632b673b055f4310bdb8637d/6965f37b67d3956f981e65fe_66a22273de11b68303bdd3c7_Creating%2520an%2520Enterprise%2520SaaS%2520Marketing%2520Strategy%2520%255BBased%2520on%2520Industry%2520Insights%2520and%2520Trends%2520in%25202023%255D.png)




.png)
















.webp)





%20Agencies%20for%20B2B%20SaaS%20Compared%20(2026).webp)

.webp)
%20with%20Hubspot.webp)








.png)


.png)

.png)
.png)
.png)
.png)


















.webp)

.webp)
.png)
.png)



.webp)


.png)


















.webp)

![How to Measure AEO Success: 12 Metrics Beyond Clicks [2026 Framework]](https://cdn.prod.website-files.com/632b673b055f4310bdb8637d/6a0d664b326187e99b3d5960_6%20-%20The%20Ultimate%20Guide%20to%20Measuring%20AEO%20Success%20in%202026.png)
![7-Step Workflow for AEO-Ready Content [2026 Framework]](https://cdn.prod.website-files.com/632b673b055f4310bdb8637d/6a0d55ea88913ede1d3a7123_5%20-%20Workflows%20for%20Optimized%20AEO-Ready%20Content%20Creation.png)
.png)
![How to Structure Content for AEO and GEO [With Templates]](https://cdn.prod.website-files.com/632b673b055f4310bdb8637d/6a0c6a56eb700472e635ff33_1%20-%20How%20to%20Structure%20%20Content%20for%20AEO%20and%20GEO%20%20Summaries%20(2026).png)




.png)
.png)









.png)


.png)




%2520Agencies%2520(2025).png)

![Top 9 AI SEO Content Generators for 2026 [Ranked & Reviewed]](https://cdn.prod.website-files.com/632b673b055f4310bdb8637d/6858e2c2d1f91a0c0a48811a_ai%20seo%20content%20generator.webp)




.webp)
.webp)













.webp)