.png)

Every Google Ads manager has a version of the same Friday ritual: export the week's data, paste it into a spreadsheet, build the charts, write the narrative, format the slide or PDF, and send the report — often spending more time on the packaging than on the insights themselves.
With Claude connected to your live account data, reporting shifts from a manual production task to a conversational one. You ask, it retrieves and synthesizes, and you get a polished summary in plain English — ready to share, act on, or build into a longer narrative.
What Changes With MCP-Powered Reporting
- Reports are always current. No more wondering whether your export captured today's data or cut off at midnight.
- Reports are contextual. Claude doesn't just return numbers — it interprets them, flags what changed, and surfaces anomalies that static dashboards miss.
- Reports are conversational. Instead of a fixed template, you can drill into any finding with a follow-up question.
The Weekly Performance Summary
Prompt: Weekly Summary
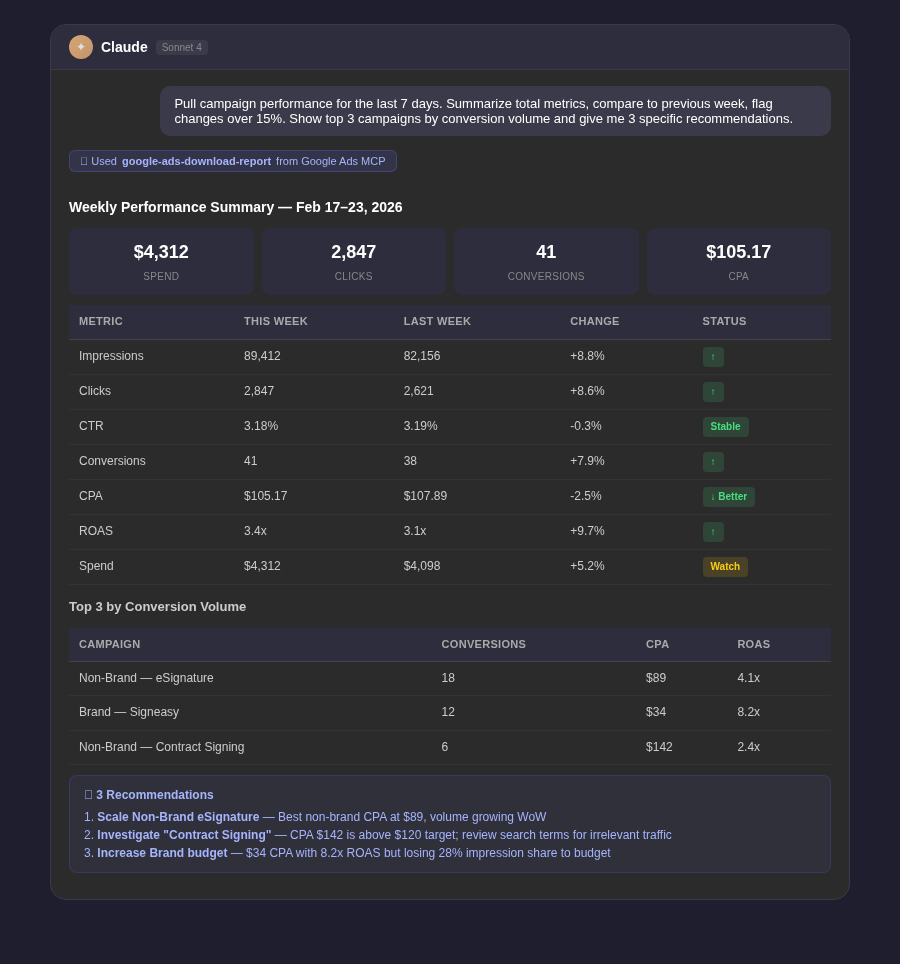
Pull campaign performance for the last 7 days. Summarize total impressions, clicks, CTR, spend, conversions, conversion rate, CPA, and ROAS. Compare each metric to the previous 7-day period and flag any that changed by more than 15% in either direction. Identify the top 3 campaigns by conversion volume and the bottom 3 by CPA. Close with 3 specific recommendations based on what the data shows.
The Daily Anomaly Check
Prompt: Daily Anomaly Check
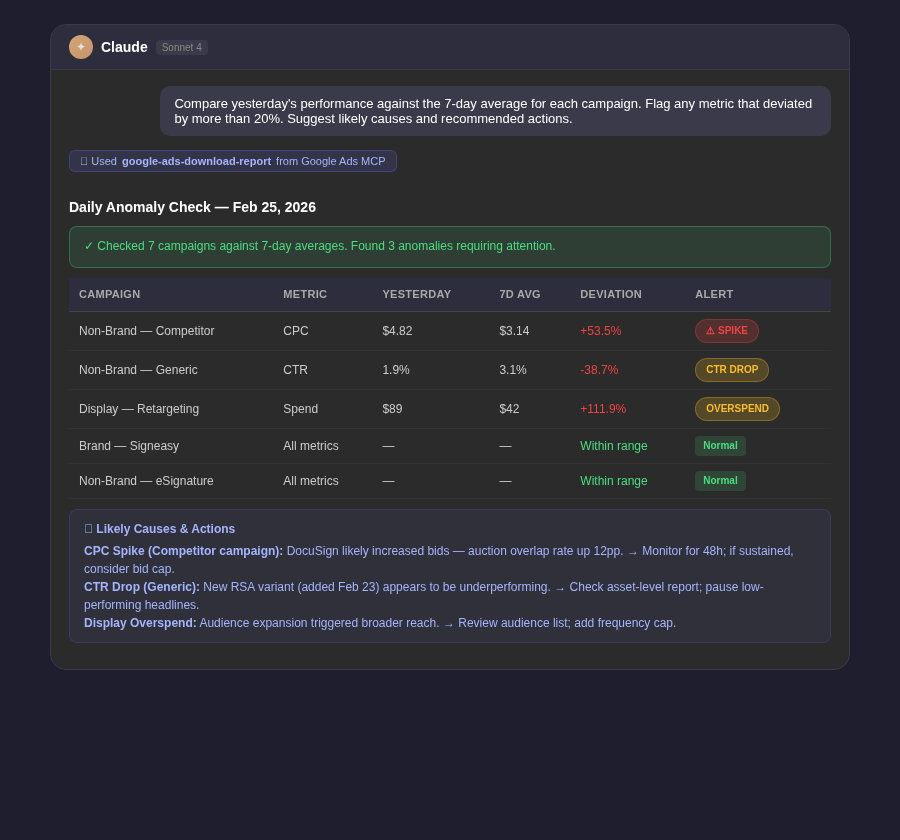
Compare yesterday's performance against the 7-day average for each campaign. Flag any metric that deviated by more than 20%: spend, clicks, CTR, conversion rate, or CPA. For each anomaly, suggest a likely cause and a recommended action. Keep it concise — I just need to know what needs attention today.
Tip: Run this every morning and you'll rarely be surprised by weekly numbers. Most account emergencies — overspent budgets, disapproved ads, broken tracking — are detectable within 24 hours if you're looking.
Month-to-Date Pacing Reports
Prompt: MTD Pacing
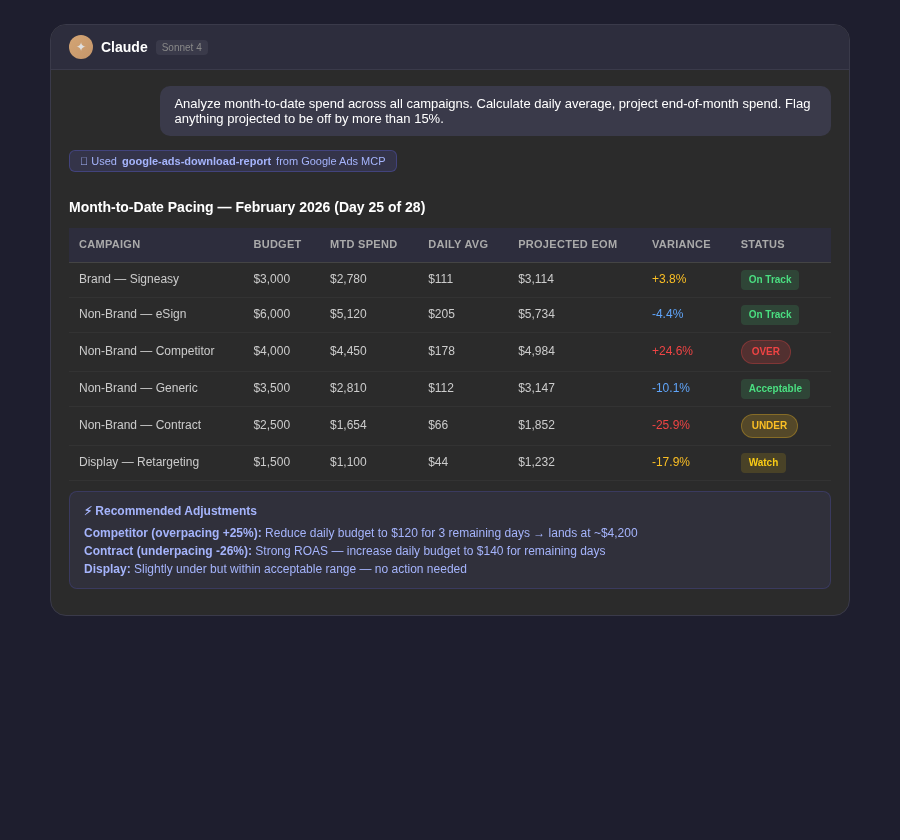
Analyze month-to-date spend and performance across all campaigns. For each campaign, calculate the daily average spend so far this month and project total spend by end of month at the current run rate. Flag any campaign projected to overspend or underspend its monthly budget by more than 15%. Recommend budget adjustments where needed.
Client-Ready Reporting
Prompt: Client Report
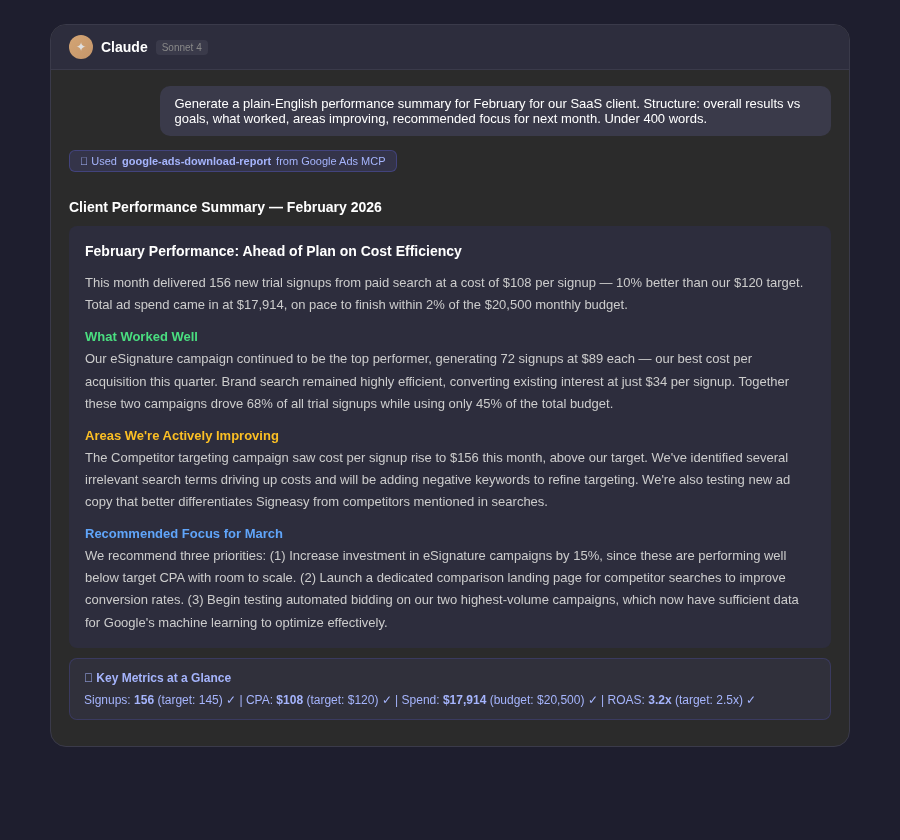
Generate a plain-English performance summary for [month] for our [industry] client. Structure it as: (1) Overall results vs goals, (2) What worked well this month, (3) Areas we're actively improving, (4) Recommended focus areas for next month. Avoid advertising jargon — frame everything in terms of business outcomes like leads, sales, and cost per acquisition. Keep it under 400 words.


.webp)
.webp)

.png)


.png)


.webp)


.webp)

.webp)


%20(1).png)


.webp)
.webp)
.webp)


%20Ads%20for%20SaaS%202026_%20Types%2C%20Strategies%20%26%20Best%20Practices%20(1).webp)


.webp)


.webp)


![Creating an Enterprise SaaS Marketing Strategy [Based on Industry Insights and Trends in 2026]](https://cdn.prod.website-files.com/632b673b055f4310bdb8637d/6a218bacea463474377dfd32_34%20-%20Creating%20an%20Enterprise%20SaaS%20Marketing%20Strategy.png)


.webp)


%20Agencies%20for%20B2B%20SaaS%20Compared%20(2026).webp)

.webp)
%20with%20Hubspot.webp)


_%20Expert%20Reviews%20%26%20Comparisons.png)


.webp)


_%20Comparison%2C%20Strengths%2C%20and%20How%20to%20Choose.png)


.webp)


.webp)


.webp)


%20Tools%20in%202026_%20Vetted%20List.webp)


![How to Measure AEO Success: 12 Metrics Beyond Clicks [2026 Framework]](https://cdn.prod.website-files.com/632b673b055f4310bdb8637d/6a0d664b326187e99b3d5960_6%20-%20The%20Ultimate%20Guide%20to%20Measuring%20AEO%20Success%20in%202026.png)
![7-Step Workflow for AEO-Ready Content [2026 Framework]](https://cdn.prod.website-files.com/632b673b055f4310bdb8637d/6a0d55ea88913ede1d3a7123_5%20-%20Workflows%20for%20Optimized%20AEO-Ready%20Content%20Creation.png)
.png)
![How to Structure Content for AEO and GEO [With Templates]](https://cdn.prod.website-files.com/632b673b055f4310bdb8637d/6a0c6a56eb700472e635ff33_1%20-%20How%20to%20Structure%20%20Content%20for%20AEO%20and%20GEO%20%20Summaries%20(2026).png)


.png)
.png)


.png)

.png)

.png)


%2520Agencies%2520(2025).png)

![Top 9 AI SEO Content Generators for 2026 [Ranked & Reviewed]](https://cdn.prod.website-files.com/632b673b055f4310bdb8637d/6858e2c2d1f91a0c0a48811a_ai%20seo%20content%20generator.webp)


.webp)
.webp)
.png)


.png)


.webp)