Why Most SaaS Organic Lead Programs Stop Growing
Every SaaS Head of Growth feels this gap:
Content output is up year over year. Channels are active. The team is producing more. Qualified leads from organic have gone flat or down.
The dashboard moves in one direction. The pipeline moves in the other. Nobody is doing the wrong job. The system is rewarding the wrong unit.
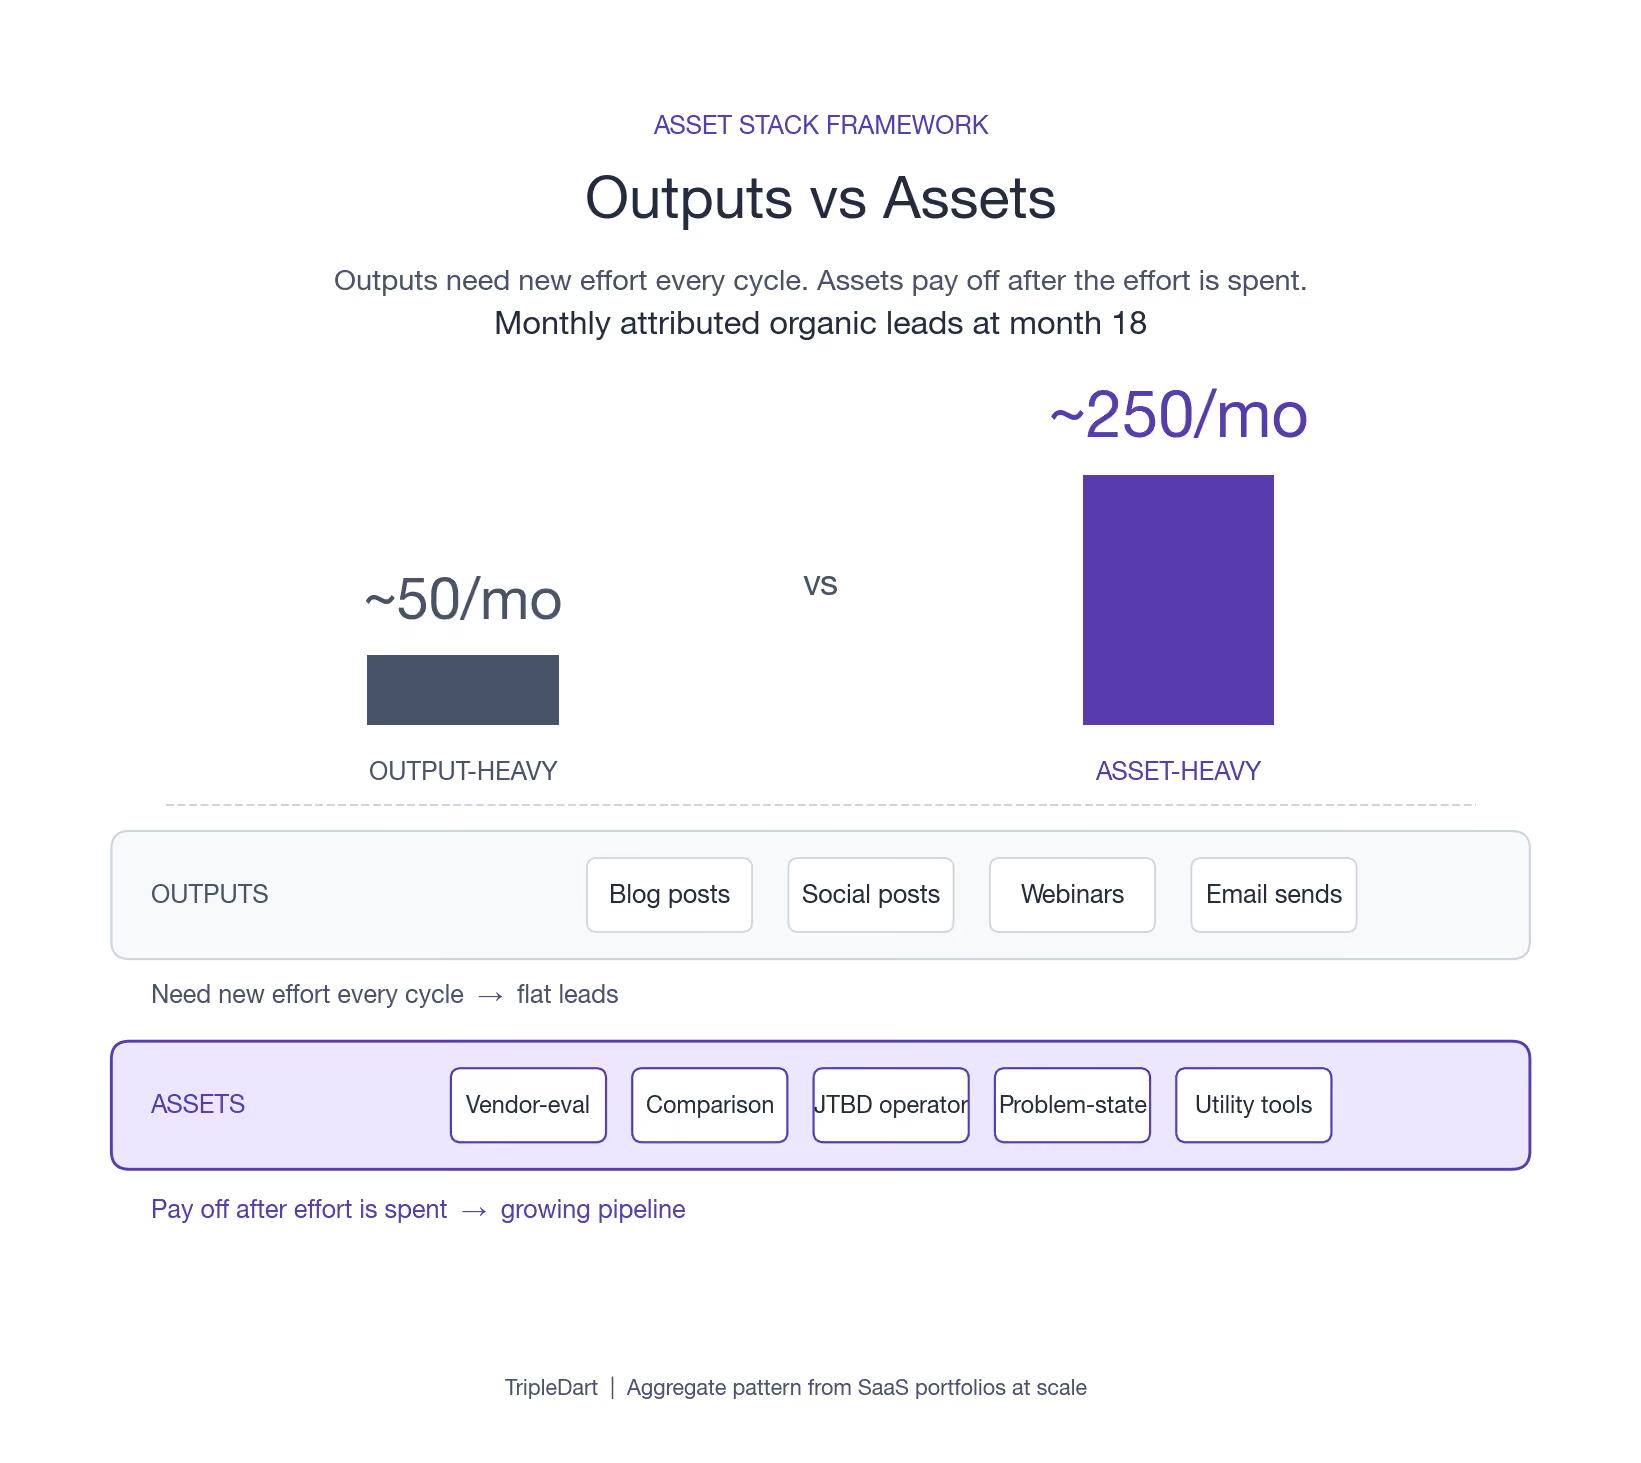
Organic lead growth in 2026 is an asset accumulation problem. The teams that go from 50 monthly leads to 500 monthly leads do not run more tactics but just accumulate more assets.
The teams stuck at 50 leads usually have more tactics than assets, which is the inverse of what scaling looks like.
The distinction:
- An output is a post published this week, a webinar run this month, a social channel kept warm. Outputs need new effort every cycle.
- An asset is a page or property that produces demos in month 14 without anyone touching it in month 13. Assets pay off after the effort is spent.
A SaaS portfolio heavy on outputs and light on assets feels productive and produces flat leads. A portfolio that is asset-heavy looks quieter and produces a payoff curve.
This guide walks five asset types worth building, the page anatomy for each, the four-phase payoff curve, the attribution stack we set up week one, the hiring profile and tools, the 12-week launch sequence, the budget math, and the tactics most SaaS teams should cut.
What Are the Best Organic Lead Assets for SaaS?
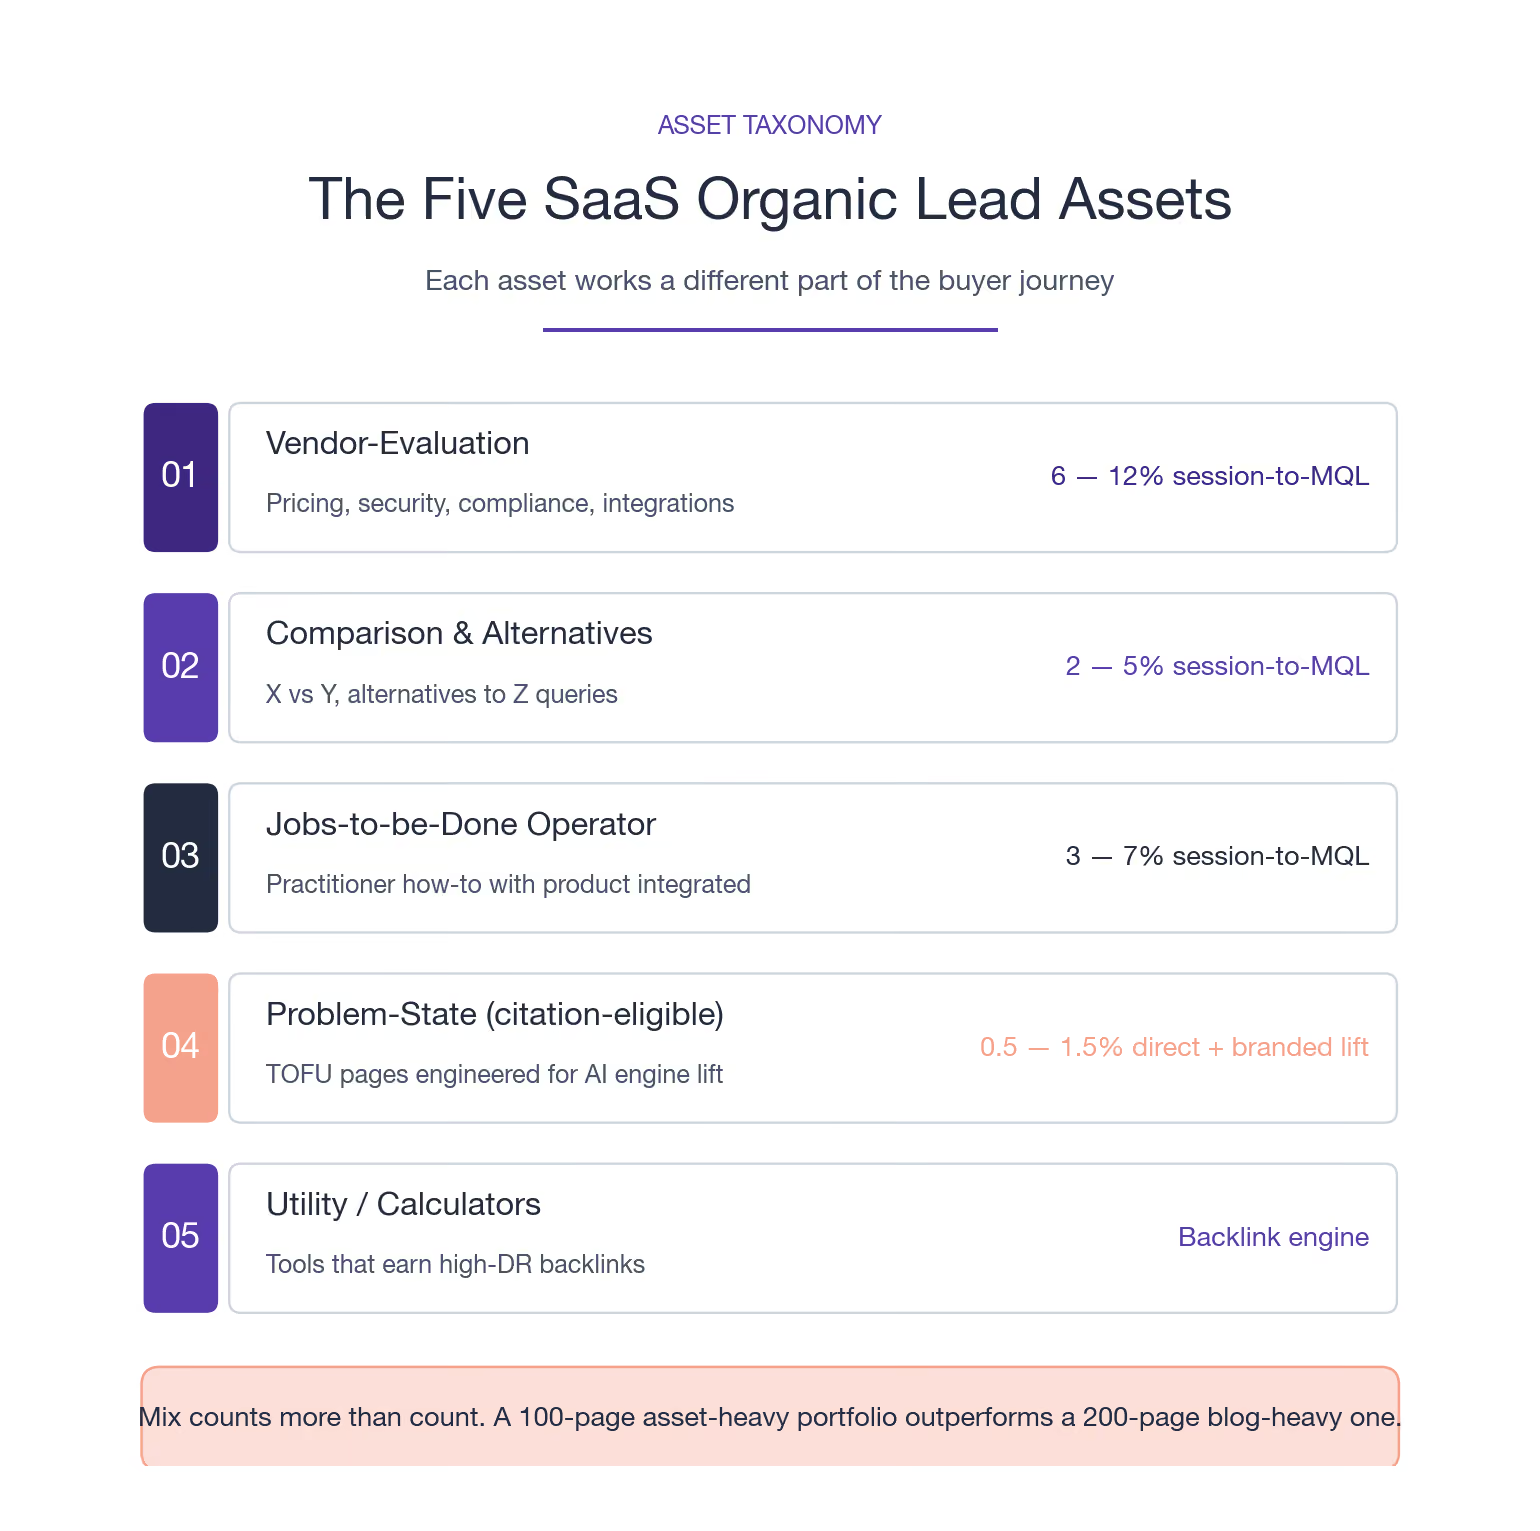
A SaaS site that scales organic leads past 200 a month typically holds five asset types, each working a different part of the buyer journey.
The teams that go past 500 monthly leads have all five running, weighted toward the asset types with the highest pipeline-to-traffic ratios. Building only one or two types is the most common pattern in stalled SaaS organic programs.
Vendor-Evaluation Pages
Vendor-evaluation pages answer the question a late-stage buyer types when they are already on a shortlist. Pricing pages, security pages, compliance documentation, integration pages, regional data residency pages.
The pipeline-to-traffic ratio on these pages typically runs 6 to 12 percent in our SaaS SEO portfolios, against 0.5 to 1.5 percent on blog content.
The catch is that they take months to rank because the SERPs are dense with the vendor's own equivalent pages. Build them in month one so they have time to mature.
Vendor-evaluation page anatomy (the template we ship):
- Pricing page: Plan tier table with monthly and annual pricing, feature inclusion per tier, seat caps, usage limits, contract terms, customer logos per tier, FAQ on price changes, an embedded ROI calculator. Schema: Product + Offer per tier.
- Security page: Certifications above the fold (SOC 2 Type II, ISO 27001, HIPAA, PCI DSS as relevant). Architecture diagram. Encryption at rest and in transit specifics. Pen test cadence. Incident response RTO/RPO. Sub-processor list with location.
- Compliance page: GDPR, CCPA, HIPAA, FedRAMP per buyer region. Data Processing Agreement download. Data retention policy. Customer rights workflow with response SLAs.
- Integration page: Native integration list with logos. Top 5 broken out individually with screenshots and setup time. iPaaS support (Workato, Tray, Zapier). Schema: SoftwareApplication per integration.
- Data residency page: Region map with deployment options. Per-region certifications. Latency benchmarks per region. Customer choice mechanism for data location.
Comparison and Alternative Pages
Comparison pages answer "X vs Y" and "alternatives to Z" queries from solution-aware buyers. Pipeline-to-traffic ratios sit in the 2x to 5x band above blog content.
Citation eligibility matters heavily here in 2026 because AI engines lift comparison tables wholesale into their answers. A well-built comparison page produces traffic from the SERP and citation pull from ChatGPT and Perplexity at the same time.
Comparison page anatomy:
- H1 naming both vendors or naming the category + "alternatives".
- One paragraph framing the decision (who the buyer is, what they are weighing).
- Primary comparison table with 8 to 14 rows: pricing, deployment, ICP fit, support tier, integrations count, security posture, contract terms, AI features, data residency, free tier availability.
- Per-vendor strength callout (4 to 6 lines each).
- "Best for" verdict section with 3 to 5 buyer scenarios, each mapped to a recommendation.
- FAQ block addressing the 6 to 8 most-asked side-by-side questions.
- Word count 2,400 to 3,200.
The single most-lifted element by AI engines is the comparison table. Get the row labels right and the page earns citations even on weeks when its ranking drops.
Jobs-to-Be-Done Operator Pages
Jobs-to-be-done pages answer the operator question from someone in the buyer seat trying to execute a specific task. Phrases like "how to build a SaaS quoting workflow without engineering" or "best way to track product activation in a freemium app."
These pages tend to produce the fastest payoff curve because the SERP is less defended. The practitioner who reads them often has buyer authority. Conversion happens through demo bookings rather than email opt-ins.
JTBD operator page anatomy:
- H1 mirroring the operator question.
- Direct-answer paragraph naming the approach in one sentence.
- Five to seven numbered steps, each as an H3.
- Per step: what to do, what tool or feature handles it, what success looks like, what to watch out for.
- Embedded product screenshot or short video clip per step.
- A "what you skipped if you tried this without a product" section near the end.
- FAQ block addressing implementation edge cases.
- Word count 2,200 to 3,000.
The product integration is the part most SaaS teams underplay. A JTBD page that wins rankings without product integration converts at half the rate of one that demonstrates the product naturally.
Citation-Eligible Problem-State Pages
Problem-state pages used to be junk for lead generation, for three reasons:
- The query was top-of-funnel.
- The buyer was unaware of vendors.
- The conversion path was vague.
In 2026 they earn back their place when they are citation-eligible: structured to be lifted by Perplexity, ChatGPT, and Google AI Overviews. The pipeline shows up later through branded search lift rather than direct conversion on the page.
Treat these as brand assets with a 9 to 18 month patience window. The B2B SaaS AEO guide covers the structural work.
Problem-state page anatomy:
- H1 mirroring the problem query verbatim where possible.
- Direct-answer paragraph (one sentence, 30 to 60 words) immediately under the H1.
- Five to seven body H2s, each opening with a direct-answer sentence.
- One comparison table or numbered list per page (high-lift formats for AI engines).
- One primary-source citation per H2, inline with the claim.
- FAQ block at the bottom (six to eight questions, all in H3 with FAQ schema).
- Article schema with dateModified, author, sameAs linking to brand entity records.
Repeat-Traffic Utility Pages
Utility pages cover calculators, ROI tools, benchmark databases, checklists, generators. The payoff mechanic is different from the other four.
The asset itself does not need to rank. The backlinks it earns power everything else in the portfolio. Unit cost to build is the highest of the five. Leverage across the rest of the program is also the highest.
One well-built calculator typically earns more high-DR backlinks in year one than 50 blog posts produce combined.
Utility page archetypes that earn the most links for SaaS:
- ROI calculators with sliders for ACV, conversion rate, retention rate.
- Salary or compensation benchmark databases for the buyer's discipline.
- Industry pricing benchmark tools.
- Free templates (sales playbooks, financial models, OKR worksheets).
- Free generators (ICP profile generator, MEDDIC checklist generator).
- Open benchmark datasets refreshed quarterly.
Unit cost to build: $8,000 to $25,000 depending on interactivity. Year-one backlink yield: 80 to 300 referring domains for a well-promoted utility.
How Long Does Organic Lead Generation Take for SaaS?
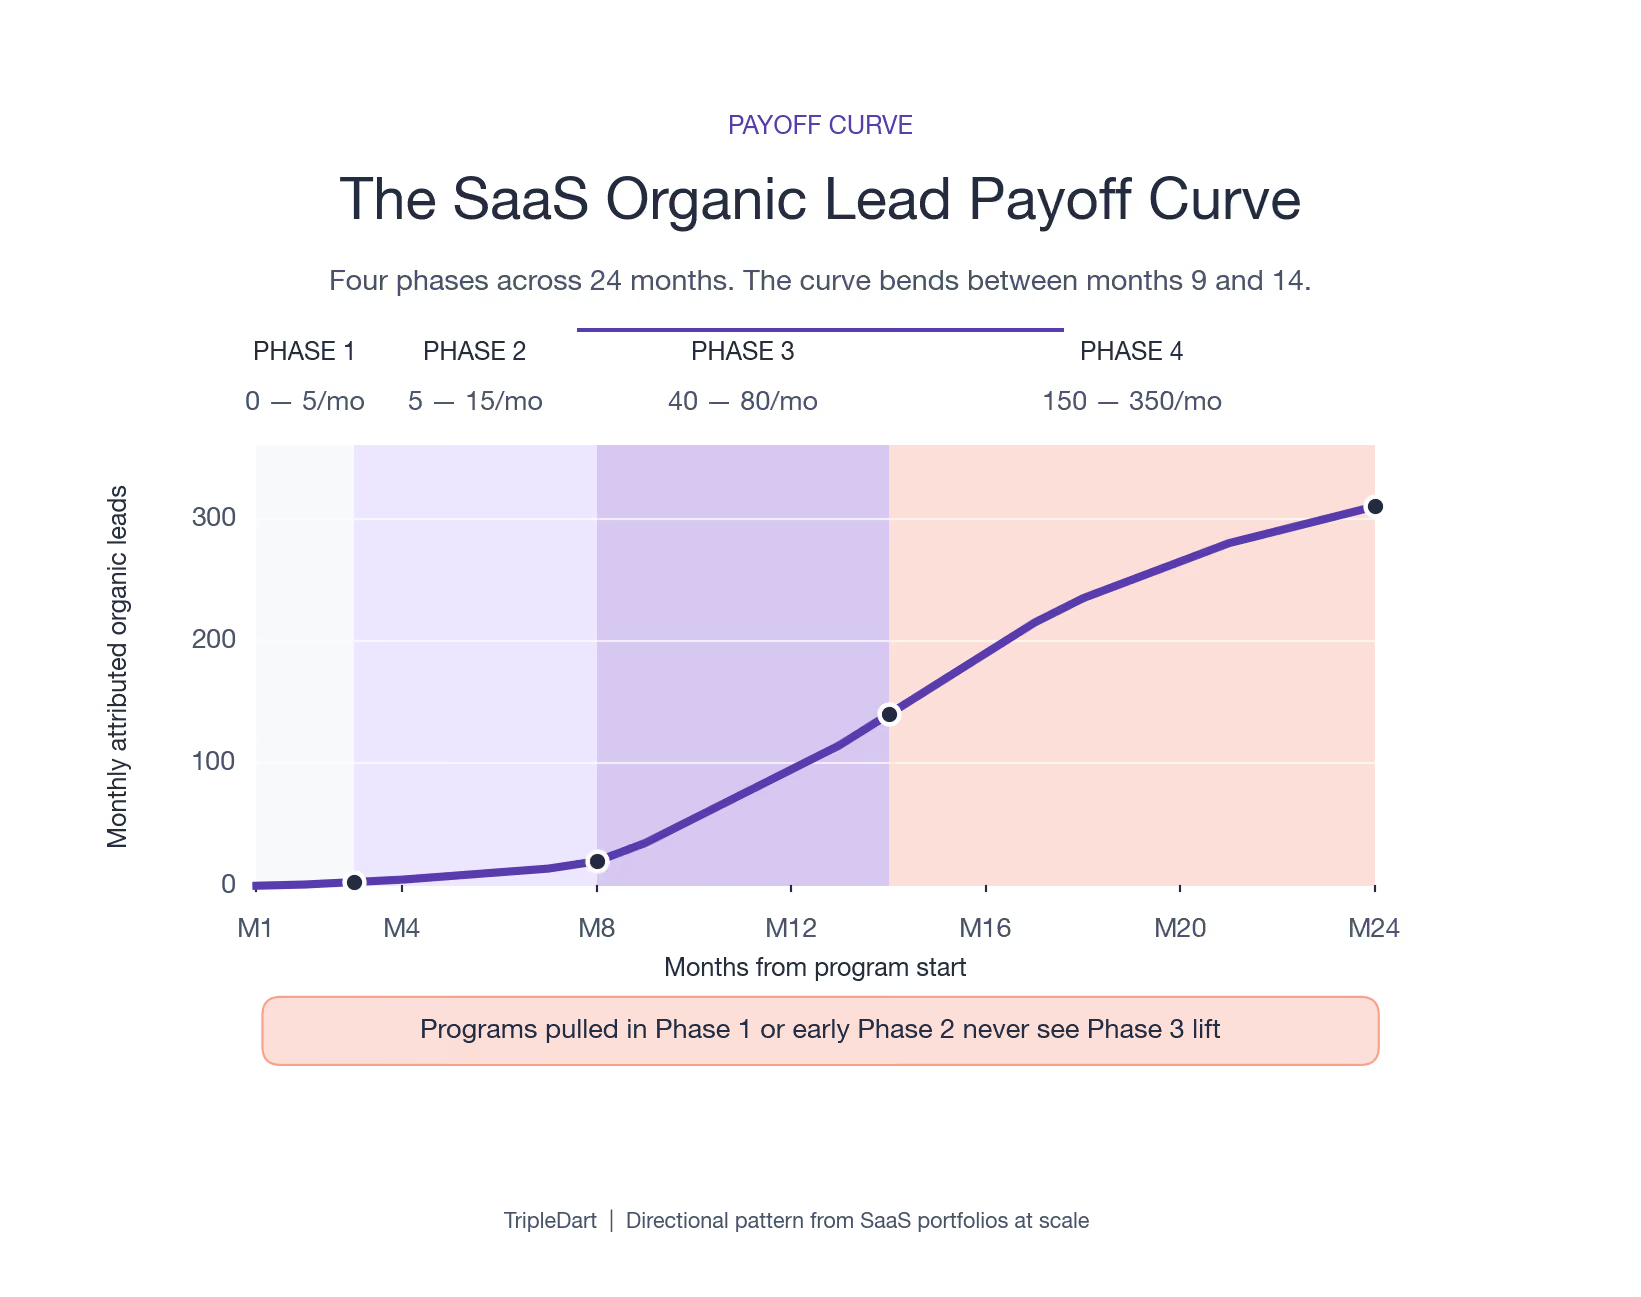
The payoff curve for a well-built SaaS organic portfolio runs in four phases. Most programs that fail do so in the phase where the curve has not yet bent.
The curve is not linear. It looks flat for months, then bends sharply, then plateaus, then bends again as the asset stack widens.
Phase 1: Months 1 to 3 (0 to 5 Leads)
Pages indexed, rankings emerging, attribution noise high. This is the phase where most internal stakeholders ask whether the program is working. The honest answer is that nobody can know yet.
The two operational priorities in Phase 1 are shipping the attribution layer (so Phase 2 attribution is clean) and shipping the first 8 to 12 Layer 3 vendor-evaluation pages (so Phase 2 rankings have time to mature). Blog content is the wrong place to focus.
Phase 2: Months 4 to 8 (5 to 15 Leads)
First rankings on vendor-evaluation and JTBD pages. Vendor-evaluation pages start producing demo bookings before the broader portfolio shows ranking improvement. This is the phase where most programs get pulled because the curve has not yet bent visibly.
The Phase 2 priorities: ship the comparison pages, expand the JTBD library, and start the citation-eligible TOFU work. The cluster intent map should be live and the Monday cannibalization scan should be running.
Phase 3: Months 9 to 14 (40 to 80 Leads)
The cluster effect kicks in. Topical authority pushes adjacent pages up the SERPs. AI citation visibility starts producing branded search lift. Monthly attributed leads cross 40 to 80 in the median program, with the spread driven by category density and prior topical authority.
Phase 3 priorities: ship the first utility asset (calculator or template), launch the first refresh sprint on Phase 1 pages, and start the international cluster planning if expansion is on the roadmap.
Phase 4: Months 15 to 24 (150 to 350 Leads)
The asset stack widens. New pages benefit from the topical authority the earlier pages built. Monthly attributed leads cross 150 to 350 for portfolios that ran the full asset taxonomy. The pipeline math becomes defensible against paid spend, often for the first time.
Phase 4 priorities: refresh the highest-revenue Layer 3 and Layer 4 pages every 90 days, expand into adjacent clusters, and start treating the organic program as an asset on the balance sheet rather than a cost line.
The Phase 2 Failure Pattern We See Most Often
Programs that survive Phase 2 produce a 4x to 7x increase in monthly attributed leads between month 8 and month 14. Programs pulled at month 6 or 7 (before the Phase 2 to Phase 3 bend) never produce the Phase 3 lift. The patience window is the most common single point of failure in a SaaS organic lead program.
The patience point is operationally consequential. The programs that produce the Phase 3 lift are the ones whose leadership team understood the curve shape before the program started.
They are not the ones that tried to explain the flat months retroactively. The curve has to be in the board deck on day one.
How AI Search Has Changed Organic Lead Generation
Top-of-funnel pages used to feed mid-funnel through email nurture and remarketing. In 2026 AI engines absorb the top-of-funnel query and never send the visitor.
Click-through on long-tail informational queries with a Google AI Overview present drops up to 58 percent according to position.digital's tracking through 2025. The page does the work. The engine takes the click.
The structural change does not kill top-of-funnel content. It changes the job of TOFU content.
The new job is brand citation, not click acquisition. A problem-state page that gets lifted by ChatGPT and Perplexity contributes to branded search 6 to 12 weeks later. That is where the lead arrives.
Most SaaS teams measure the page-level outcome (clicks, on-page conversion) and miss the branded-search delta the page is producing. The team concludes TOFU does not work and cuts the budget, exactly when the citation engine has started to function.
The operator response is to re-architect TOFU for citation, with:
- Direct-answer openers on every H2, 30 to 60 words, self-contained.
- Named entities declared explicitly throughout the page, with sameAs entity linking in schema.
- Structured data in the form of comparison tables, FAQ schema, BreadcrumbList.
- Recent update dates in the visible page and in dateModified schema.
- Primary source citations that AI engines can verify (Sparktoro studies, position.digital reports, Backlinko keyword data).
A page that carries those signals produces brand pull through AI engines even when its click-through rate drops. The AEO vs SEO guide covers the structural differences in detail.
Our GEO services walk through the per-page audit pass we run for clients whose TOFU has stopped converting.
The cut decision still applies. Cut TOFU pages that are not citation-eligible and cannot be made so inside one revision pass. Keep the ones that can.
How to Measure Organic Lead Generation Performance
Most SaaS organic lead programs cannot answer the simple question "which page produced last month's leads." The ambiguity is the reason finance defunds the program at month 9, often before the curve has had the chance to bend.
The measurement layer needs to be in place before the first content investment, not after. Three measurements together make a SaaS organic program defensible:
- Pipeline-to-traffic ratio per page type: Track session-to-MQL and session-to-SQL separately for each asset type.
- Branded search delta: The proxy for citation impact on TOFU pages.
- Multi-touch attribution: Last non-direct touch is the closest practical match for B2B SaaS organic.
The per-asset-type ratios stay stable enough to plan against. The aggregate organic conversion rate is meaningless because the asset mix changes month to month.
The GA4 Setup We Ship Week One
GA4 needs custom events and conversions configured before the first page goes live, otherwise the attribution layer has gaps that take a quarter to fix retroactively. The setup:
- Custom events: demo_request, pricing_view, signup, pricing_calculator_use, comparison_table_interaction, utility_tool_complete. Each fires with the page slug and the asset-type custom dimension.
- Custom dimensions: asset_type (vendor_eval, comparison, jtbd, problem_state, utility), cluster_name, funnel_stage (tofu, mofu, bofu).
- Conversions: Mark demo_request and signup as conversions. Mark pricing_view and comparison_table_interaction as micro-conversions.
- Attribution model: Data-driven attribution at the account level, plus last non-direct touch in custom reports for the CMO dashboard.
- Custom audiences: Visitors who hit any Layer 3 page within the last 90 days. Useful for paid retargeting and for measuring branded search lift downstream.
The HubSpot or Salesforce Layer
The CRM-side attribution closes the loop from MQL to revenue. The setup:
- UTM scheme: Every internal link and every external campaign uses a strict UTM convention:
utm_source(organic, paid, email, etc.),utm_medium(search, social, referral),utm_campaign(cluster name),utm_content(page slug). Internal links carry no UTMs to avoid attribution pollution. - Custom properties:
first_touch_page, last_non_direct_touch_page, first_touch_cluster, assisted_clusters(multi-select). These propagate from contact to deal. - Lifecycle stage triggers: MQL trigger: any conversion event on a Layer 3 page or any pricing calculator completion. SQL trigger: BANT-qualified by sales, manually.
- Reporting: Weekly dashboard with MQLs and SQLs by
first_touch_cluster,by asset_type, and by individual page URL. Monthly rollup to revenue.
The Branded Search Tracker
The leading indicator of citation impact on TOFU pages. Set up:
- Define the brand search query set (10 to 25 variations of the brand name plus product names).
- Pull weekly impression counts from Search Console for the brand set.
- Track 7-day rolling average and 28-day rolling average.
- Compare to 90-day prior baseline.
- Plot against the count of citation-eligible TOFU pages live.
When the program is working, the 28-day rolling branded impression curve starts lifting 6 to 10 weeks after the first batch of citation-eligible TOFU pages ships.
The political point that ships with the measurement layer: an organic program survives long enough to produce the Phase 3 lift only when finance can attribute pipeline back to specific pages.
Without that attribution, the program dies before its curve bends. The SaaS content strategy framework we run with clients includes the measurement layer in week one for this reason.
The 12-Week Launch Sequence
We run the same week-by-week sequence with every new SaaS organic lead program. The order matters because each step unlocks the next.
Weeks 1-2: Foundation.
- Audit existing pages against the five asset types. Tag every page.
- Build the cluster intent map in Airtable or Notion.
- Set up GA4 with the custom events and dimensions.
- Set up HubSpot or Salesforce with the UTM scheme and custom properties.
- Set up the branded search tracker baseline.
- Document the asset gaps the audit surfaced.
Weeks 3-4: Vendor-Evaluation Build.
- Ship the pricing page (or refresh if one exists).
- Ship the security page.
- Ship one integration hub page.
- Run a sales/CS interview session to surface Layer 3 and Layer 4 query gaps.
Weeks 5-6: Comparison and Alternatives.
- Ship 3 to 4 comparison pages against the top competitors surfaced in win-loss interviews.
- Ship 1 alternatives-to page targeting a category leader.
- Brief the next batch of vendor-evaluation pages.
Weeks 7-8: JTBD Library Kickoff.
- Ship the first 4 JTBD operator pages.
- Embed product screenshots per step.
- Brief the next 8 JTBD pages from the sales/CS interview output.
Weeks 9-10: Citation-Eligible TOFU Start.
- Ship the first 3 problem-state pages with full citation architecture.
- Set up monthly citation tracking for Perplexity, ChatGPT, Google AIO.
- Brief the next 6 problem-state pages.
Weeks 11-12: First Utility Asset + First Review.
- Ship one utility asset (calculator, template, or benchmark database).
- Run the first 12-week review with finance and leadership.
- Plot the curve against the four-phase forecast.
- Set the Phase 2 ship schedule.
By the end of Week 12, the portfolio carries roughly 16 to 22 pages plus one utility asset. The measurement layer is producing weekly reports. The cluster intent map has 40 to 60 cells planned for Phase 2.
Organic Lead Generation Launch Checklist (12-Week)
Tick each item off as it ships. The order matters: skipping the measurement layer or the cluster intent map in week one is the most common failure mode we see.
1. Audit existing pages against the five asset types. Tag every URL with its layer.
2. Build the cluster intent map in Airtable or Notion with the schema above.
3. Ship the GA4 custom events, dimensions, and conversions.
4. Ship the HubSpot or Salesforce attribution properties and UTM scheme.
5. Run the first sales and CS interview session to harvest Layer 3 and Layer 4 queries.
6. Ship the pricing page (or refresh if one exists).
7. Ship the security page.
8. Ship one integration hub page.
9. Ship 3 to 4 comparison pages against top competitors.
10. Ship 1 alternatives-to page targeting a category leader.
11. Ship the first 4 JTBD operator pages with product screenshots.
12. Ship the first 3 problem-state pages with full citation architecture.
13. Set up monthly citation tracking against a 25-query anchor set.
14. Ship one utility asset (calculator, template, or benchmark database).
15. Run the 12-week review with finance. Plot actual leads against the forecast curve.
Live SaaS Pages Worth Studying
The pages below are public examples of each asset type from B2B SaaS brands as of 2026. Open them in a new tab and study the structure before briefing your own.
Vendor-evaluation pages worth studying:
- Pricing: Linear pricing, Notion pricing, HubSpot pricing.
- Security: Datadog security, Stripe security, Linear trust.
- Compliance: Vanta security, Auth0 compliance.
- Integrations: Slack marketplace, Zendesk marketplace.
Comparison and alternative pages worth studying:
JTBD operator pages worth studying:
- HubSpot's "how to write a marketing plan".
- Ahrefs' "how to do keyword research".
- Stripe's usage-based billing guide.
Utility tools worth studying for backlink leverage:
Study each page for the elements that make it convert: the direct-answer opener, the named entities, the schema, the embedded utility. The patterns travel across categories.
The Hiring Profile and Tools Stack
The program runs with a small team if the team is the right shape. The teams that scale organic to triple digits run with:
Core team (in-house or partnered):
- One SaaS-native content strategist: Owns the cluster intent map, briefs every page, runs the sales/CS interviews. 5 to 10 years SaaS marketing, with a portfolio of comparison and vendor-evaluation pages they have shipped.
- Two to four senior writers: Each owns 2 to 3 clusters. SaaS subject matter depth beats general writing skill. Writers should be able to produce a Layer 3 pricing page or Layer 4 JTBD page without needing the strategist to draft the outline.
- One technical SEO + GEO specialist: Owns schema implementation, site architecture, internal linking, citation tracking infrastructure. 4 to 7 years technical SEO with GEO/AEO experience.
- One RevOps analyst (shared with the broader RevOps team): Owns the GA4 and CRM attribution stack. Half-time involvement.
- One designer (shared): Owns the utility tool builds and the screenshot/video embeds for JTBD pages. Quarter-time involvement.
Tools stack:
- Search Console + GA4 for ranking and attribution baseline.
- Ahrefs or Semrush for keyword validation and competitor monitoring.
- Airtable or Notion for the cluster intent map.
- HubSpot or Salesforce for the CRM-side attribution.
- Perplexity Pro and ChatGPT Plus for citation tracking and discovery prompting.
- Otterly, Profound, or AthenaHQ if budget allows, for automated AI citation tracking. Otherwise manual monthly checks against a 25-query anchor set.
- Schema.org validator and Rich Results Test for QA on every page ship.
Which Organic Lead Tactics Should SaaS Teams Cut First?
Most SaaS teams have permission to add tactics and no permission to remove them. The asset stack reverses that.
The teams that scale organic leads run fewer tactics with higher leverage per tactic. The teams that stall run more tactics with lower leverage. Five tactics look productive on a dashboard and rarely produce qualified leads in 2026:
1. High-volume blog post output on TOFU queries that are not citation-eligible: The page produces neither clicks (AI Overview takes them) nor citations (the page is not structured for lift). The team is publishing into a void. Cut the cadence in half and reinvest the hours into making the remaining pages citation-eligible.
2. Gated lead magnets on every blog post regardless of intent: The list generated is dominated by researchers, students, and low-intent browsers. Email nurture sequences built on that list produce open rates that look fine and demo rates that are close to zero. Gate selectively, on Layer 2 and Layer 3 pages where the gate intent matches the buyer state.
3. Webinars without a downstream nurture or remarketing layer: A live webinar with no plan for what happens to the audience 48 hours later is a one-time content production. The teams that run webinars as lead engines tie each session to a Layer 3 page in the same topic cluster, so the live audience and on-demand replay both feed into pipeline.
4. Social media presence as a primary lead engine: Organic social produces brand pull, not pipeline. Treat it as a brand asset and measure it as branded search and direct demo bookings rather than direct click attribution. Teams that run social with that framing produce more brand value with less effort.
5. Email nurture campaigns sent to a list built from low-intent TOFU lead magnets: A list dominated by Layer 1 opt-ins produces nurture sequences that get high open rates and low conversion rates. Either rebuild the list around Layer 2 and Layer 3 sources or wind the nurture program down.
The operator move is to cut one of the five every quarter and reinvest the saved hours into asset accumulation. Most SaaS teams cannot cut five at once because the political cost is too high. One a quarter is sustainable.
Organic Lead Generation Benchmarks From SaaS Programs at Scale
The patterns below are directional and useful as planning benchmarks rather than promises. They hold across categories from observability to billing to RevOps to HR tech.
1. The single biggest gap between programs that scale and ones that stall is the asset-to-publishing ratio in months 1 to 6: Programs that scale run roughly 2:1 asset-building (pricing pages, comparison pages, JTBD pages, utility tools) to publishing (blog posts, social, email). Programs that stall invert the ratio.
2. Vendor-evaluation pages built in month one contribute the largest share of pipeline by month 12: Programs that delay vendor-evaluation pages until "the SEO has matured" routinely produce a 50 to 70 percent pipeline gap against programs that built them first.
3. Measurement-first programs survive Phase 2 at twice the rate of measurement-last programs: Programs that ship per-asset-type pipeline-to-traffic ratios, branded search tracking, and multi-touch attribution before the first content investment survive Phase 2 at roughly twice the rate of programs that ship measurement after. Cost to build measurement first: two weeks of RevOps work. Cost of skipping it: a defunded program at month 9.
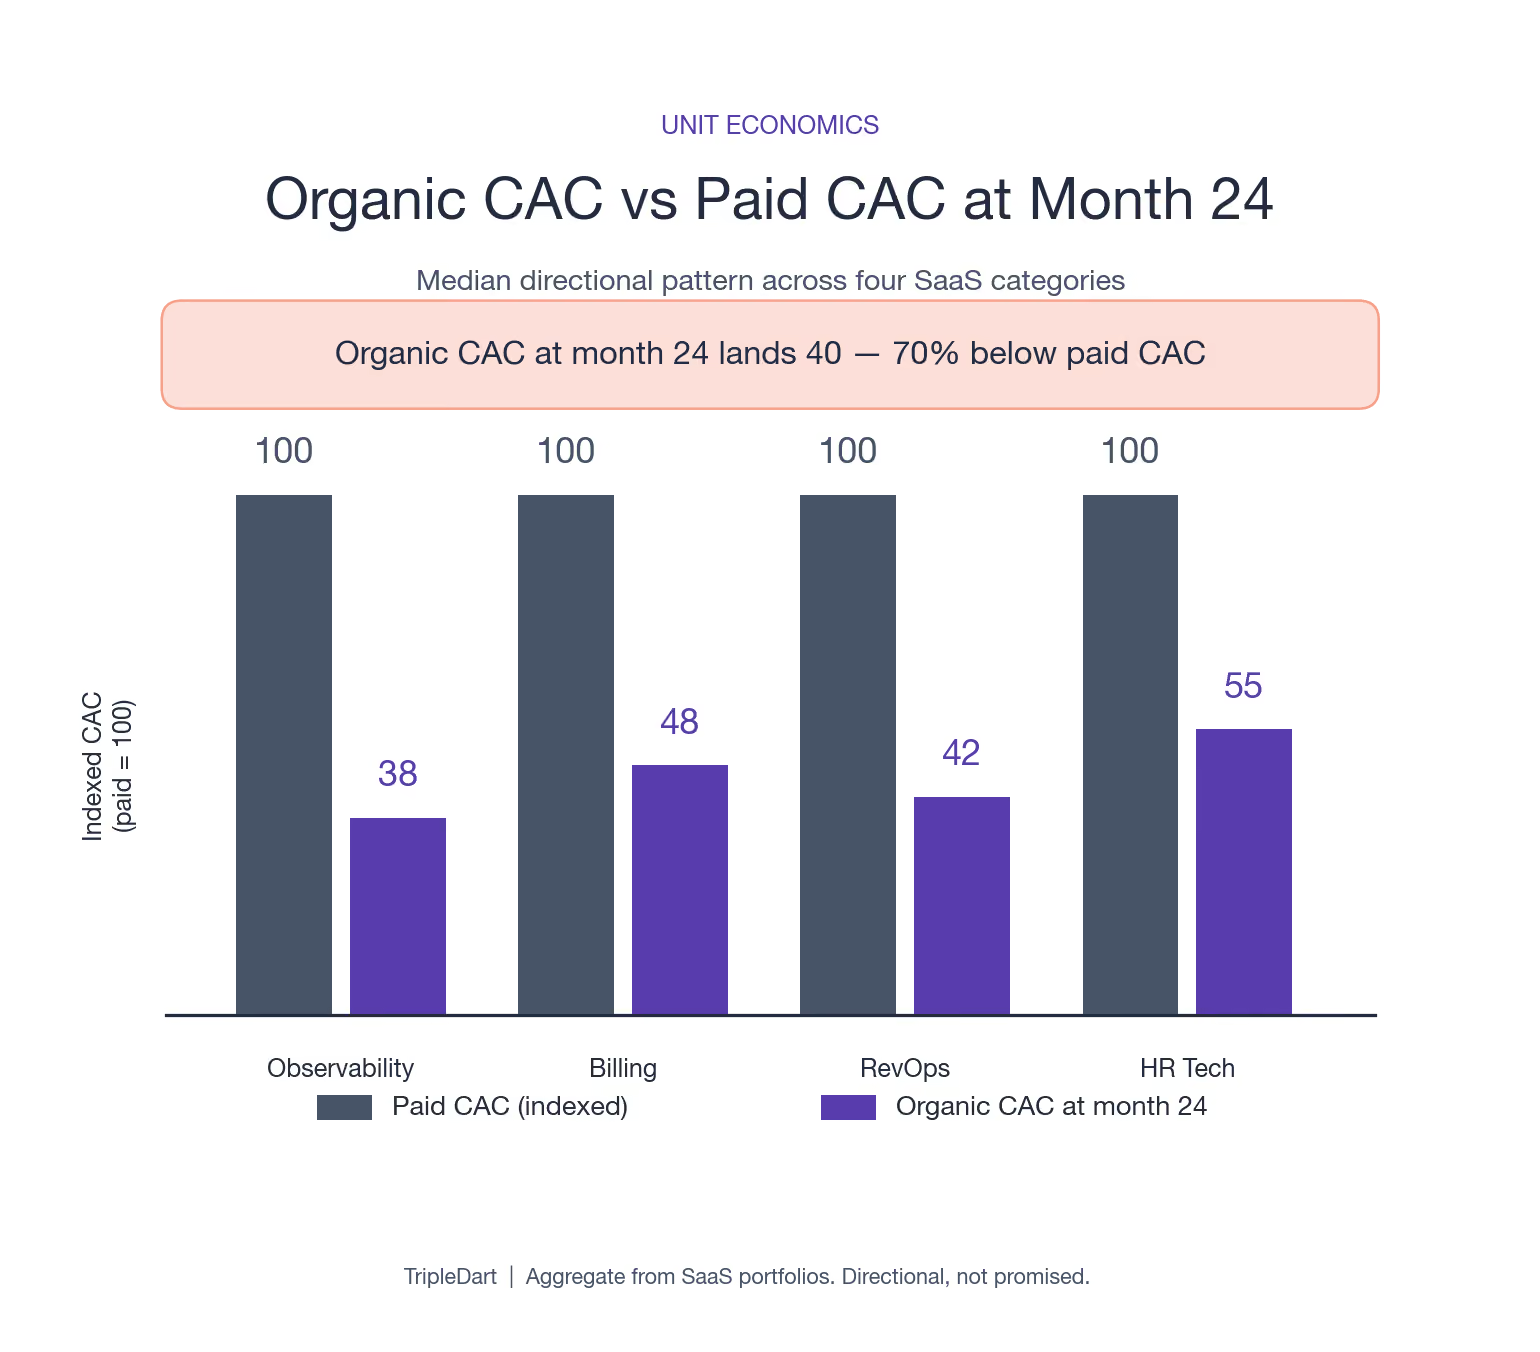
4. Organic CAC at month 18 lands 40 to 70 percent below paid CAC: The gap widens after month 24 as the asset stack matures. Teams that ran the program to Phase 4 are the ones that found their organic CAC structurally lower than paid for the rest of the company's life.
Budget Math for a Year-One Organic Lead Program
The directional fully-loaded cost we use with clients:
Programs that hire externally for the strategist and writers and run a smaller in-house core often land at the lower end: $180,000 to $260,000 fully loaded.
The payback math: a program that produces 200 monthly leads by month 18 at a 12 percent MQL-to-SQL rate and a 22 percent SQL-to-close rate produces roughly 5 to 6 new logos a month.
At an ACV of $24,000, the program produces $1.4M to $1.7M in new ARR by end of year two against a $400K to $600K cumulative investment. The unit economics tighten substantially in year three as the asset stack matures.
The CAC Gap We See by Month 24
Organic CAC at month 24 typically lands 1.6x to 2.5x below paid CAC in the same SaaS category. The gap is widest in dense, multi-vendor categories (observability, sales engagement, CRM) where paid auction prices have inflated faster than organic asset accumulation costs.
Edge Cases and Trade-Offs
The asset stack works across most B2B SaaS categories, but the weighting and the page templates vary by motion and segment.
- PLG SaaS with public pricing: The Layer 4 weighting goes up because operator queries convert directly to self-serve sign-ups. The Layer 3 weighting drops because the pricing page handles its own conversion. Target asset mix: 15-20-30-35 across L1-L2-L3-L4.
- Sales-led enterprise SaaS: The Layer 3 weighting goes up because enterprise buyers need security, compliance, and procurement-grade documentation pages. Target mix: 10-25-45-20.
- Freemium SaaS: Utility pages carry more weight because the freemium product can be embedded as a lightweight version inside the calculator or tool. Target mix: 15-20-25-25, with 15 percent utility.
- Regulated industries (fintech, healthtech): Compliance pages dominate Layer 3 and need legal review per page. Add 30 to 45 percent to per-page production cost and extend timelines by 4 to 6 weeks per compliance page.
- International expansion: Each region needs a Layer 3 data residency page and localized comparison pages. Translation and localization cost roughly $1,200 to $2,000 per page. The international cluster typically lifts the parent program's branded search by 12 to 24 percent within a year.
The Anti-Patterns That Sink SaaS Organic Programs
Five mistakes show up in roughly two-thirds of the stalled SaaS organic programs we audit. Each is correctable in a single sprint if the team agrees to act.
1. Shipping content before the attribution layer: The team produces 30 pages in months 1 to 4. Finance asks at month 5 which pages produced the few leads that came in. Nobody can answer. The program loses budget at month 9 when the curve has not yet bent. Fix: ship GA4 + CRM attribution week one, before the first page.
2. Building the cluster intent map after the first 20 pages ship: Cannibalization sets in by month 6. The team writes a "definitive" third page to settle the issue. Now three pages compete for the same query. Fix: cluster map week one. Monday cannibalization scan from week three onward.
3. Hiring generalist writers instead of SaaS-native subject matter writers: A generalist writer produces a competent Layer 1 blog post. The same writer cannot produce a credible Layer 3 pricing page or a Layer 4 JTBD operator page because they do not know the operator's workflow. Fix: hire writers with shipped portfolios in the asset types you need.
4. Treating utility tools as nice-to-have: Utility tools earn 5 to 10x more high-DR backlinks than equivalent blog posts. A program that delays its first utility asset to Phase 3 misses the topical authority lift the early backlinks would have produced. Fix: ship one utility asset by week 12.
5. Cancelling at month 6 because the curve has not bent: The most common single failure. The curve bends in months 9 to 14 by design. Cancelling early restarts the clock with the next program and the same flat months come back. Fix: publish the four-phase curve in the board deck day one. Make the patience window a leadership commitment, not a marketing promise.
Bringing the Framework Together
Organic lead growth in 2026 has a shape and a timeline. The shape is the asset stack of five page types worked together, weighted toward the assets with the highest pipeline-to-traffic ratios.
The timeline is the four-phase payoff curve. The bend happens between months 9 and 14. The math becomes defensible against paid by month 18.
The measurement layer is what keeps the program funded long enough to produce the bend. Without it, the program dies before the curve has a chance to work.
TripleDart runs the SEO, content, GEO, and RevOps programs that produce these curves for 250+ B2B SaaS portfolios like WeWork, Atlas, Cognizant, and Freshworks.
If your organic lead curve has gone flat while content output is rising, build a defensible organic engine with the asset stack your team needs to push past Phase 2.
Frequently Asked Questions
How long does it take to increase organic leads for a SaaS site?
The first 5 to 15 monthly leads attributable to organic typically arrive in months 4 to 8 for a well-built asset portfolio. Programs that scale to triple-digit monthly leads usually hit that range in months 9 to 14. The curve looks flat through months 1 to 3.
How many pages does a SaaS site need to scale organic leads?
A portfolio that scales to 150 to 300 monthly organic leads typically carries 80 to 200 indexed pages. The weighting counts more than the count.
A 200-page portfolio that is 80 percent blog content produces less pipeline than a 100-page portfolio that is 60 percent Layer 3 and Layer 4.
Is SEO still worth the investment with AI Overviews intercepting clicks?
Yes, and the answer is on the measurement side. SaaS organic pipelines now divide into click-through pipeline (vendor-evaluation, comparison, JTBD pages) and citation pipeline (problem-state pages lifted into AI engines, driving branded search lift downstream). Both produce demos.
What is a good pipeline-to-traffic ratio for organic in SaaS?
Median ratios from our portfolio observations: 0.5 to 1.5 percent session-to-MQL on blog content, 3 to 7 percent on JTBD operator content, 6 to 12 percent on vendor-evaluation pages. Ratios vary by category and ICP fit. The full per-asset-type table above is the planning version.
What is the typical budget for a year-one SaaS organic lead program?
Year-one fully loaded cost runs $180,000 to $414,000 depending on in-house vs partnered staffing.
The lower end is achievable with external strategist and writers and a small in-house core. The upper end builds the full team in-house. Both produce comparable Phase 4 outcomes when the asset stack is built correctly.
Should SaaS teams stop publishing top-of-funnel content?
No, but the job of TOFU content has changed. Stop publishing TOFU pages that are not citation-eligible.
Re-architect remaining TOFU for direct-answer surfaces, named entities, and AI engine retrieval. Measure success in branded search lift on a 6 to 12 week lag. The HubSpot research on SEO trends covers the broader pattern.
Which organic tactic should a SaaS team cut first?
The highest-cost lowest-leverage tactic in most SaaS programs is gated lead magnets on low-intent TOFU content. The lists generated are dominated by low-intent opt-ins.
The gating itself drops click-through on the page that produced the magnet. Cut it on Layer 1 pages. Keep it on Layer 2 and Layer 3 pages where the gate intent matches the buyer state.
How does CAC from organic compare to paid for SaaS?
Median organic CAC by month 18 of a well-run program sits 40 to 70 percent below paid CAC in the same SaaS category. The gap widens after month 24 as the asset stack matures.
The widest gaps appear in dense, multi-vendor SaaS categories where paid auction prices have inflated faster than organic asset accumulation costs.
What is the most common reason SaaS organic lead programs fail?
Two patterns dominate. Programs that publish high volumes of TOFU content without an asset taxonomy or measurement layer feel productive while pipeline stays flat.
Programs that get cancelled in Phase 1 or early Phase 2 lost patience before the four-phase curve had a chance to bend between months 9 and 14. The Ahrefs research on SEO timelines corroborates the second pattern.
What is the right team size to run a SaaS organic lead program?
The core team is one content strategist, two to four senior writers, one technical SEO + GEO specialist, half-time RevOps support, and quarter-time design.
Smaller programs run a 4 to 5 person team with contractor writers. Enterprise programs run 8 to 12 people with in-house everything.