.png)
Key Takeaways
Your brand ranks #1 on Google for your highest-value keyword. But when a prospect asks ChatGPT for a recommendation, you're nowhere in the response. Your competitor, the one you outrank in organic search, gets named by name. They close the deal. You never knew the conversation happened.
This is the measurement gap that GEO metrics exist to close. Traditional SEO metrics, rankings, organic clicks, impressions, click-through rate, were built for a world where search meant ten blue links. In 2026, a significant and growing share of search interactions happen through AI-generated responses. AI referral traffic grew 527% year over year, and Google AI Overviews now appear on 30-40% of queries. Those traditional metrics don't capture any of it.
Generative Engine Optimization (GEO), also called LLMO or Large Language Model Optimization, is the practice of optimizing your brand's content and digital presence to appear in AI-generated search responses across ChatGPT, Perplexity, Google AI Overviews, and Claude. GEO metrics are the KPIs that tell you how well that's working.
This guide covers the seven specific GEO metrics that matter most, how to calculate each one, which tools to use, and a step-by-step framework you can implement this week. In 2026, GEO measurement has moved from experimental to essential. If you rely on organic search for pipeline, this is no longer optional.
What Are GEO Metrics?
GEO metrics are the KPIs used to measure a brand's visibility, authority, citation frequency, and sentiment within AI-generated search responses. They tell you how your brand performs when ChatGPT, Perplexity, Google AI Overviews, or Claude answers a question relevant to your product or category.
These aren't a replacement for traditional SEO metrics. They're a complementary measurement layer. Traditional SEO metrics tell you how you perform in standard search results. GEO metrics, sometimes called AI search metrics, tell you how you perform in AI-generated answers. Both matter, and both require active tracking.
In 2024, GEO was a niche concept discussed by early adopters. By mid-2025, dedicated tools and frameworks began emerging. In 2026, it's a core marketing discipline for any brand investing in organic visibility.
GEO vs. SEO - Why You Need Both
GEO doesn't replace SEO. Strong SEO foundations, domain authority, high-quality content, structured data, topical depth, backlink profiles, are the primary inputs AI engines use when deciding which brands to cite. A brand with weak SEO will almost certainly have weak GEO performance.
The measurement gap is real, though. You can rank #1 in Google's organic results for "best project management software" but be completely absent when ChatGPT answers the same question. Conversely, a brand with strong web-wide mentions and authoritative content might appear in AI responses despite ranking on page 2 of Google. The GEO vs. SEO relationship is additive, not competitive.
Shared signals that feed both: domain authority, content quality, structured data, topical relevance. Unique to GEO: AI visibility score, brand mention frequency, sentiment analysis, citation rate. Tracking only SEO metrics means you're blind to AI search. Tracking only GEO metrics means you're ignoring the foundation that feeds AI visibility.
How AI Search Engines Select and Surface Brands
AI engines decide which brands to mention based on several overlapping factors. Source authority matters first. AI engines favor content from domains with strong backlink profiles and established expertise signals. Content recency is weighted heavily, especially for queries where timeliness matters. Structured data and well-formatted pages make it easier for AI engines to extract and cite information accurately.
Brand mentions across the web also play a significant role. AI engines are trained on web-wide data, so brands mentioned frequently and positively across multiple authoritative sources are more likely to appear. Comprehensive, expert-level content optimization earns citations; surface-level content gets ignored. This is sometimes called GEO LLM optimization in practitioner communities.
Each AI engine behaves differently, and that matters for measurement.
You can't treat all AI engines as a monolith. A brand with strong Perplexity visibility may be nearly absent from ChatGPT responses, and if your buyers primarily use ChatGPT, your aggregate numbers are misleading.
Which GEO Metrics Actually Matter in 2026?
These seven metrics form the core KPI set every marketing team should track, organized from visibility (are you showing up?) to quality (how are you showing up?) to impact (is it driving results?). You don't need to track all seven from day one. Start with three or four and expand as your measurement process matures. But understanding all seven is what builds a complete picture of your AI search performance.
1. AI Search Visibility Score
AI Search Visibility Score is the foundational GEO metric: the percentage of relevant AI-generated responses where your brand appears. If you're not visible, nothing else matters.
AI Search Visibility Score = (Number of AI responses mentioning your brand / Total relevant queries monitored) x 100
For example: you monitor 100 queries related to your product category across ChatGPT, Perplexity, and Google AI Overviews. Your brand appears in 23 of those responses. Your AI Search Visibility Score is 23%.
Benchmark guidance varies by category. A SaaS brand in a crowded space like CRM might see 10-20% visibility as a strong starting point. A niche B2B tool might achieve 40-60%. The key is to establish your baseline and measure improvement over time, not to chase an arbitrary number. Start with your 50 highest-value commercial queries and expand to 100+ once your tracking process is stable.
Brand visibility in AI search is the single metric that tells you whether you exist in your buyers' AI-assisted research process. Everything else builds on it.
2. Brand Mention Frequency
Brand Mention Frequency is the raw count of how often your brand is named in AI responses over a given time period. There's a critical distinction here: a brand mention ("HubSpot is a popular CRM for small businesses") is different from a source citation ("According to an article on hubspot.com..."). Brand mentions are more valuable because they indicate the AI engine considers your brand noteworthy enough to recommend by name.
Track AI brand mentions across engines, segment by query category (product queries, comparison queries, problem-solution queries), and monitor trends weekly. The distinction between mention types matters strategically:
- Primary mention: "For project management, Asana is the top choice for mid-size teams." The brand is the direct answer.
- Secondary mention: "Popular project management tools include Monday.com, Asana, ClickUp, and Notion." The brand is one of several listed.
Primary mentions carry significantly more weight. A brand that consistently earns primary mentions is being positioned as the answer, not just an option. Tracking the ratio of primary to secondary mentions over time tells you whether your authority is growing or stagnating.
3. Share of Voice in AI Responses
Share of Voice (SOV) measures your brand's share of total mentions relative to competitors within the same query set. Raw visibility is meaningless without competitive context.
Share of Voice = (Your brand mentions / Total brand mentions for all competitors in the query set) x 100
If your brand appears in 30% of AI responses but your top competitor appears in 65%, you're losing the AI search battle despite seemingly decent numbers. Define a competitive set of five to ten direct competitors, track the same query set for all brands, and calculate each brand's share weekly or monthly.
SOV analysis reveals which query clusters competitors dominate, letting you prioritize content improvements where the gap is largest. Don't forget to include AI-native competitors, brands that may not compete with you in organic search but appear frequently in AI responses for your key queries.
4. Citation Rate and Source Attribution
Citation Rate measures how frequently AI engines cite your specific content, URLs, articles, pages, as a source in their responses.
Citation Rate = (Number of citations to your domain / Total citations in monitored responses) x 100
Citations matter beyond visibility. They drive referral traffic when users click through to the source, build authority signals that reinforce future AI visibility, and provide a measurable link between your content and AI search performance. Monitor which specific URLs from your domain are cited, track citation trends over time, and identify your most-cited content assets.
Citation behavior varies significantly by engine:
Citation rate must be tracked per AI engine, not as a single aggregate number. A strong Perplexity citation rate and a weak ChatGPT citation rate require different optimization responses.
5. Sentiment and Framing Analysis

Sentiment and Framing Analysis tracks not just whether AI engines mention your brand, but how they describe you. Being mentioned frequently but framed as "affordable but limited" or "a legacy tool losing market share" is actively harmful. Being framed as "the industry leader" or "the most trusted option" is enormously valuable.
Track sentiment across three categories:
Run sentiment checks monthly. A sudden shift from positive to neutral framing can indicate a competitor is gaining ground, or that negative content about your brand is influencing AI training data. If AI engines consistently frame your brand in a way that doesn't match your positioning, that's a signal to address at the content and messaging level.
6. Query Coverage Breadth
Query Coverage Breadth measures the range and diversity of query types where your brand appears in AI responses. Appearing in AI responses for only ten queries is fundamentally different from appearing across 300 relevant queries. Breadth indicates topical authority. AI engines surface brands that demonstrate comprehensive expertise across a topic area, not just depth on a single subtopic.
Query Coverage Breadth = (Unique query clusters where your brand appears / Total relevant query clusters in your market) x 100
Build a comprehensive query map for your market, organized into clusters. For a CRM company, this includes: "best CRM for startups," "CRM vs spreadsheet," "how to choose a CRM," "CRM implementation tips," "CRM integrations," and so on. Monitor coverage across all clusters. The strategic use is identifying white space, query clusters where you have zero AI visibility. These become your content creation priorities.
Query cluster types to map: product comparison queries, problem-solution queries, "best X for Y" queries, how-to queries, alternative/replacement queries, integration queries, and pricing queries.
7. AI-Driven Traffic and Conversion Attribution
AI-Driven Traffic and Conversion Attribution closes the loop, connecting AI search visibility to actual business outcomes: traffic, leads, pipeline, and revenue. This is the hardest GEO metric to track.
Many AI interactions are zero-click. According to Seer Interactive, 58.5% of Google searches in the U.S. already end without a click, and that rises to 75% on mobile. Users who do visit after seeing your brand in an AI response often arrive via direct navigation or branded search, showing up as "direct" or "branded organic" traffic in analytics, with no trace of the AI interaction that started the journey. This is the dark funnel challenge.
Despite the difficulty, there are practical attribution methods:
- Referral traffic analysis: Monitor your analytics for traffic from AI engine referrers. Look for sources like chatgpt.com, chat.openai.com, and perplexity.ai.
- Branded search lift correlation: Track branded search volume trends over time. If branded searches increase as your AI visibility improves, that's a strong directional signal.
- Post-visit surveys: Add a "How did you hear about us?" field to your signup or demo request forms. Include "AI search (ChatGPT, Perplexity, etc.)" as an option.
- UTM-tagged content: Where possible, include UTM-tagged links in content you expect AI engines to cite.
- Dedicated landing pages: Create specific landing pages mentioned in AI-optimized content to track attribution directly.
A prospect sees your brand recommended by ChatGPT, Googles your brand name the next day, and signs up for a demo. In your analytics, this shows up as "branded organic search," with no trace of the AI interaction that started the journey. Focus on directional trends rather than precise numbers. The goal is to establish a correlation between GEO improvements and business outcomes, not to achieve pixel-perfect attribution.
How Can You Track GEO Metrics Using Tools and Methods?
The GEO monitoring tool landscape has matured significantly in 2026, with both dedicated platforms and DIY approaches available. Your choice depends on budget, team size, and how many AI engines you need to monitor.
Dedicated GEO Monitoring Tools
The emerging tool landscape offers several strong options. This isn't an exhaustive list. The space is evolving rapidly, and new tools emerge frequently. Evaluate based on your specific AI engine coverage needs, budget, and integration requirements.
Practitioners on Reddit have noted the tradeoffs between tools. One thread in r/b2bmarketing described enterprise-grade platforms as offering "deep monitoring and analysis" that's "great if you want long-term tracking and reporting for stakeholders," but noted that lighter tools work well for teams just getting started. The right tool depends on your stage, not just your budget.
Manual Tracking and DIY Approaches
For teams without budget for dedicated tools, or wanting to supplement tool data with hands-on research, manual tracking is a viable starting point for learning how to measure AI search visibility.
Method 1: Systematic Prompt Testing.
Build a spreadsheet with 50-100 key queries. Every week, run each query across ChatGPT, Perplexity, and Google AI Overviews. Document whether your brand appears, how it's mentioned (primary vs. secondary), and the sentiment. Track changes over time. Time investment: two to four hours per week for 50 queries.
Method 2: Referral Traffic Analysis.
In Google Analytics 4, create a custom report filtering for referral traffic from AI engine domains (chatgpt.com, perplexity.ai, etc.). Monitor weekly. This won't capture zero-click interactions but gives you a baseline for direct AI-driven traffic.
Method 3: Branded Search Correlation.
Use Google Search Console or Google Trends to track branded search volume over time. Correlate increases in branded search with your GEO optimization efforts. Not a direct measurement, but a strong directional signal.
Method 4: Competitive Spot-Checks.
Monthly, run your ten highest-value queries and document which competitors appear, in what order, and with what framing. Build a simple competitive tracking spreadsheet.
Manual approaches are free and build intuition, but they're time-intensive, not scalable, and prone to inconsistency since AI responses vary by session. Use them as a starting point or supplement, not a long-term solution.
Integrating GEO Metrics into Your Existing Analytics Stack
GEO data should sit alongside organic search, paid, and brand metrics, not in a silo. Recommended dashboard tools include Looker Studio (free, integrates with most data sources), Databox (good for multi-source dashboards), or custom dashboards in your existing BI tool.
A practical dashboard layout includes four panels: AI Search Visibility Score trend line, Share of Voice bar chart, Citation Rate by AI engine, and Sentiment breakdown. That structure gives you the full picture at a glance.
Reporting cadence matters as much as the dashboard itself:
Someone on the team must own GEO monitoring. In most SaaS organizations, this falls to the SEO manager or content marketing lead, but it should be reviewed by the Head of Growth or VP of Marketing monthly.
If you'd like to partner with a team that has built GEO measurement programs for over 250 B2B SaaS companies, reach out. Our generative engine optimization services cover everything from tool selection and query universe definition to dashboard setup and ongoing monitoring.
How Do You Build a GEO Measurement Framework Step by Step?
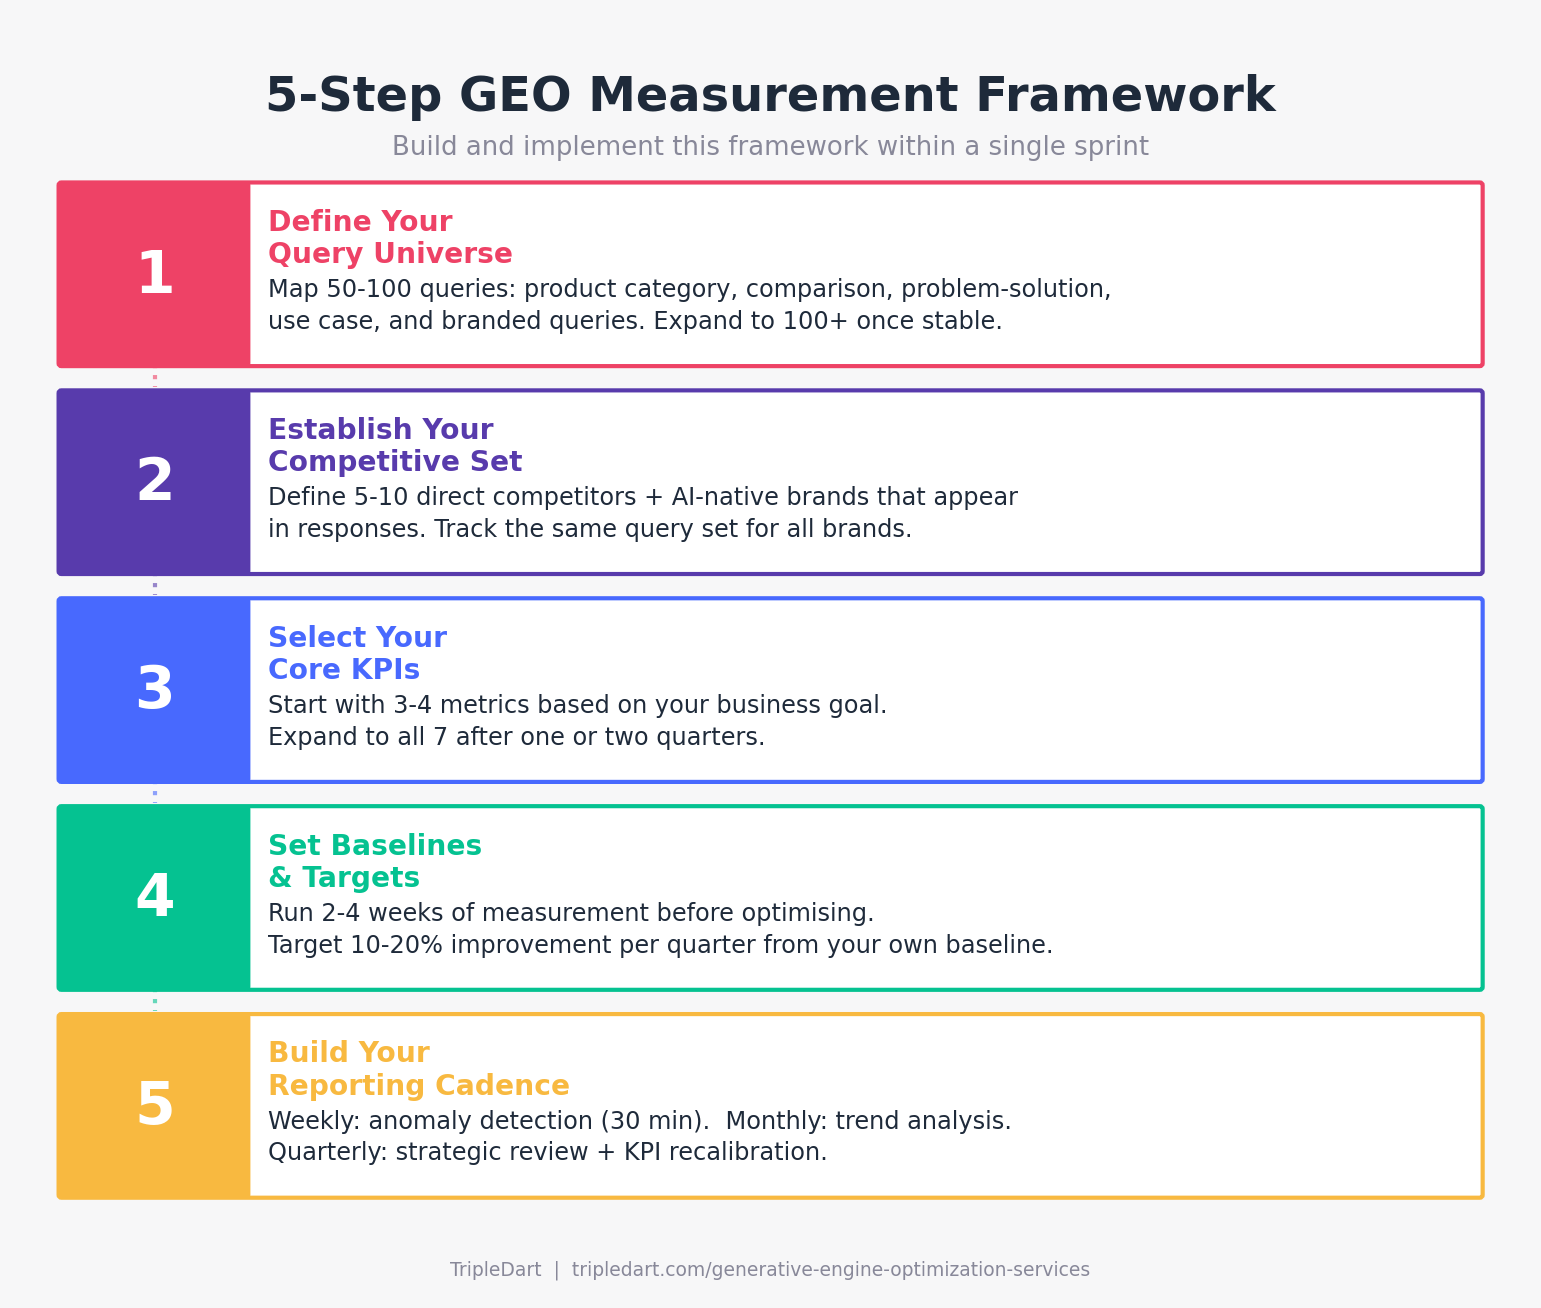
Tracking individual metrics is necessary but insufficient. To turn GEO data into strategic decisions, you need a structured measurement framework. Here's how to build one in five steps, designed to be implementable within a single sprint.
Step 1: Define Your Query Universe
The foundation of any GEO measurement program is the query set you monitor. Identify the queries that matter most to your business: product category queries ("best CRM software"), use case queries ("CRM for sales teams"), comparison queries ("HubSpot vs Salesforce"), problem-solution queries ("how to manage sales pipeline"), and branded queries ("is [your brand] good for X?").
Start with your highest-value commercial and comparison queries. These have the most direct business impact. We recommend starting with 50-100 core queries.
Step 2: Establish Your Competitive Set
Define five to ten direct competitors to benchmark against. Include both traditional competitors and "AI-native" competitors, brands that may not show up in your traditional competitive set but appear frequently in AI responses for your key queries.
Competitive set selection criteria:
- Direct product/service competitors
- Brands appearing in AI responses for your key queries (even if unexpected)
- Industry thought leaders whose content gets cited frequently
- Adjacent category players that AI engines sometimes recommend as alternatives
Track the same query set for all competitors to enable apples-to-apples comparison. AI engines sometimes surface brands you wouldn't consider competitors, a blog, a marketplace, or a niche tool. Include them.
Step 3: Select Your Core KPIs
Don't try to track all seven GEO metrics from day one. Start with three or four core metrics based on your business goals, then expand after one or two quarters as measurement matures.
Step 4: Set Baselines and Targets
Before setting targets, you need a baseline. Run an initial two to four week measurement period where you track your selected KPIs without trying to optimize. This establishes your starting point.
Then set targets based on your own baseline, not industry averages. The space is too new and too variable for reliable cross-industry benchmarks. Aim for 10-20% improvement per quarter in core metrics. For brands starting from near-zero visibility, initial gains may be faster. For brands with established visibility, gains will be more incremental.
Baseline measurement checklist:
- Query universe defined (50-100 queries)
- Competitive set established (5-10 brands)
- Core KPIs selected (3-4 metrics)
- Tracking tool or manual process set up
- 2-4 weeks of baseline data collected
- Baseline report documented
Step 5: Build Your Reporting Cadence
GEO monitoring must have a clear owner. It can't be everyone's job, or it becomes no one's job. The SEO manager or content marketing lead owns the weekly and monthly cadence. The VP of Marketing or Head of Growth owns the quarterly strategic review.
What Are Common GEO Measurement Mistakes to Avoid?

GEO measurement is new enough that most teams make avoidable mistakes. Here are the five most common, and how to fix each one.
1. Treating GEO Metrics Like SEO Rankings
Mistake: Checking AI visibility once and treating the result as a definitive ranking.
Consequence: GEO visibility is probabilistic, not deterministic. Unlike SEO rankings, which are relatively stable, AI responses vary by session, user context, phrasing, and time of day. A single check that shows you're absent doesn't mean you've "lost."
Fix: Focus on trends over four or more weeks, not individual snapshots. Run each query ten times and track the frequency of appearance. Averages over time are the signal; individual results are noise.
2. Ignoring Sentiment in Favor of Visibility
Mistake: Celebrating increasing visibility without checking how your brand is being described.
Consequence: Being mentioned frequently but framed as the budget option or the legacy tool is worse than not being mentioned at all. Visibility without sentiment context is an incomplete picture.
Fix: Always pair visibility metrics with sentiment analysis. If visibility is rising but sentiment is neutral or negative, investigate before celebrating.
3. Measuring Too Few Queries
Mistake: Building a query set of ten to twenty queries and treating the results as representative.
Consequence: AI responses vary enough that a small query set produces unreliable, noisy data. You can't identify real trends from a sample that small.
Fix: Monitor at least 50 queries to start, ideally 100+. Segment by query type so you can identify patterns within clusters, not just overall averages.
4. Overlooking AI Engine Differences
Mistake: Aggregating all AI engines into a single visibility score.
Consequence: You might have strong visibility in Perplexity but be absent from ChatGPT. If your audience primarily uses ChatGPT, your aggregate score is actively misleading.
Fix: Track each AI engine separately in addition to an aggregate score. Prioritize the engines your target audience actually uses. A thread in r/GenerativeSEOstrategy put it well: "Big mistake is treating GEO like SEO with clean metrics. It's messier. We track presence across multiple models, consistency of positioning."
5. Failing to Connect GEO Metrics to Business Outcomes
Mistake: Reporting GEO metrics in isolation without tying them to traffic, pipeline, or revenue.
Consequence: A team that reports "our AI visibility score increased 15%" without connecting it to business outcomes will eventually lose budget and executive support.
Fix: Always tie GEO reporting back to business metrics. Even if attribution is imperfect, show the correlation: "AI visibility increased 15% → branded search volume increased 12% → demo requests from branded search increased 8%." Directional correlation is better than no connection at all.
What Is the Future of GEO Metrics Beyond 2026?
The following trends are already emerging and will mature in the next 12-18 months.
- Real-time GEO monitoring. Tools will move from periodic checks to continuous, real-time monitoring of AI responses, similar to how uptime monitoring works for websites.
- Standardized metric definitions. Expect industry bodies or major tool providers to establish standardized GEO metric definitions and benchmarks, similar to how viewability standards emerged in digital advertising.
- AI-to-AI optimization. As AI agents increasingly make purchase decisions on behalf of users, AI shopping assistants, autonomous procurement agents, GEO metrics will need to expand beyond search to include AI-to-AI interactions. AI search optimization will mean something broader than it does today.
- Predictive visibility scoring. Tools will begin predicting your likelihood of appearing in AI responses for new queries based on your content profile, authority signals, and competitive landscape.
- Convergence of GEO and SEO measurement. As AI becomes embedded in all search experiences, the distinction between SEO metrics and GEO metrics will blur. Expect unified measurement dashboards within 18-24 months.
The brands that build GEO measurement capabilities now will have 12-18 months of baseline data when industry benchmarks finally emerge. That's a significant competitive advantage over teams that wait for the tools and standards to mature before starting.
Optimize Your GEO Measurement Program
As an AI-native SEO agency for B2B SaaS, we've built GEO measurement frameworks for SaaS brands across fintech, HR tech, cybersecurity, and developer tools, and the pattern is consistent. The teams that win in AI search are the ones that start measuring early, even imperfectly, and iterate from a real baseline. Glean, for example, saw a 275% increase in monthly organic clicks after we rebuilt their content and SEO strategy from the ground up, and that foundation directly feeds their AI search visibility today.
"TripleDart is a super helpful team, tremendously aiding in SEO enhancements from blog topics to technical recommendations." - Daniel Henderson, Glean
At TripleDart, we help B2B SaaS marketing teams select the right GEO monitoring tools, define their query universe, establish competitive benchmarks, and build reporting dashboards that connect AI search visibility to pipeline. Our AI search optimization services are built on the same playbooks we've refined across 250+ clients, not theory, but tested frameworks that produce measurable results in 90 days or less.
Frequently Asked Questions
1. What is GEO (Generative Engine Optimization)?
GEO, or Generative Engine Optimization, is the practice of optimizing a brand's content and digital presence to maximize visibility, citations, and positive sentiment in AI-generated search responses across platforms like ChatGPT, Perplexity, Google AI Overviews, and Claude. It's also referred to as LLMO (Large Language Model Optimization) in practitioner communities. Unlike traditional SEO, which optimizes for standard search engine results pages, GEO optimizes for AI-generated answers where users often never click through to a website. Both disciplines are necessary for complete search visibility in 2026.
2. What are the most important GEO metrics to track?
The seven core GEO metrics are: AI Search Visibility Score, Brand Mention Frequency, Share of Voice in AI Responses, Citation Rate and Source Attribution, Sentiment and Framing Analysis, Query Coverage Breadth, and AI-Driven Traffic and Conversion Attribution. Teams should start with three or four. AI Search Visibility Score, Share of Voice, Citation Rate, and Sentiment are the recommended starting points. Expand to the full set as your measurement process matures. These AI search metrics give you a complete picture of how your brand performs across the AI search landscape.
3. Is SEO dead now that AI search is growing?
No. SEO remains foundational to GEO performance. Strong SEO signals, domain authority, content quality, structured data, backlink profiles, are the primary inputs AI engines use when deciding which brands to cite. A brand with weak SEO will almost certainly have weak GEO performance. The GEO vs. SEO relationship is additive: the brands winning in AI search are those with strong SEO foundations who have also built GEO-specific measurement and optimization practices on top of them.
4. How do you track brand visibility in ChatGPT and Perplexity?
There are two approaches. Dedicated tools like Otterly.ai, Profound, Scrunch AI, and the GEO Metrics platform can automate monitoring across AI engines, tracking brand mentions, citations, and competitive positioning at scale. Manual methods include systematic prompt testing (running defined queries weekly across AI engines and documenting results in a spreadsheet) and referral traffic analysis (monitoring Google Analytics 4 for traffic from AI engine domains like chatgpt.com and perplexity.ai). Each AI engine requires slightly different tracking approaches due to differences in citation behavior. Perplexity is citation-heavy while ChatGPT rarely links to sources directly.
5. What's the difference between GEO metrics and traditional SEO metrics?
Traditional SEO metrics, keyword rankings, organic traffic, impressions, click-through rate, measure visibility in standard search engine results pages. GEO metrics, AI visibility score, brand mention frequency, citation rate, sentiment analysis, measure visibility, authority, and perception within AI-generated responses. They're complementary measurement layers, not competing ones. Tracking only SEO metrics leaves you blind to AI search performance. Tracking only GEO metrics ignores the SEO foundation that feeds AI visibility. A complete picture of search performance in 2026 requires both.
6. How often should you measure GEO metrics?
A three-tier cadence works best. Weekly quick-scan monitoring checks for anomalies and significant visibility changes, takes about 30 minutes, and produces a brief team update. Monthly deep-dive analysis covers trend analysis, competitive shifts, and content performance by query cluster. Quarterly strategic reviews assess framework effectiveness, recalibrate KPIs, and inform resource allocation decisions. AI responses can change more frequently than organic rankings, so regular monitoring matters. That said, avoid over-reacting to daily fluctuations, which are often noise rather than signal.
7. Can you improve your GEO metrics without specialized tools?
Yes, but with real limitations. Manual tracking methods, systematic prompt testing across AI engines, referral traffic analysis in Google Analytics, branded search volume correlation via Google Search Console, and competitive spot-checks, work well for initial exploration and building intuition about how AI engines treat your brand. The limitations are real: manual approaches are time-intensive, not scalable beyond 50-100 queries, and prone to inconsistency since AI responses vary by session. They're best used as a starting point or supplement to dedicated tools, not as a long-term measurement solution for teams serious about GEO performance.
8. How long does it take to see improvements in GEO metrics?
Initial baseline measurement takes two to four weeks. Meaningful improvements in AI Search Visibility Score and Brand Mention Frequency typically appear within one to three months of consistent optimization efforts, content updates, authority building, structured data improvements, and earning web-wide brand mentions. GEO isn't an overnight fix. It's influenced by content quality, brand authority, and the breadth of your web presence across the entire web. Brands starting from near-zero visibility may see faster initial gains. Established brands with existing authority will see more incremental improvement but from a stronger starting position.
9. How does TripleDart help with GEO metrics?
We're an AI-native SEO agency for B2B SaaS, and we build and run GEO measurement programs from the ground up, using proprietary AI workflows (including our Slate platform) to accelerate query universe definition, competitive benchmarking, and content gap analysis at a scale that manual processes simply can't match. Our team has worked with 250+ companies across fintech, HR tech, cybersecurity, and developer tools, and we've developed tested playbooks for each stage of GEO maturity. Whether you're starting from scratch or looking to mature an existing program, we bring the frameworks, tooling expertise, and execution capacity to make GEO measurement a core part of your inbound GTM engine.


.webp)
.webp)

.png)


.png)


.webp)


.webp)

.webp)


%20(1).png)


.webp)
.webp)
.webp)


%20Ads%20for%20SaaS%202026_%20Types%2C%20Strategies%20%26%20Best%20Practices%20(1).webp)


.png)


.png)


.webp)


![Creating an Enterprise SaaS Marketing Strategy [Based on Industry Insights and Trends in 2026]](https://cdn.prod.website-files.com/632b673b055f4310bdb8637d/6965f37b67d3956f981e65fe_66a22273de11b68303bdd3c7_Creating%2520an%2520Enterprise%2520SaaS%2520Marketing%2520Strategy%2520%255BBased%2520on%2520Industry%2520Insights%2520and%2520Trends%2520in%25202023%255D.png)


.webp)


%20Agencies%20for%20B2B%20SaaS%20Compared%20(2026).webp)

.webp)
%20with%20Hubspot.webp)


.png)


.png)

.png)
.png)
.png)
.png)


.webp)

.webp)
.png)
.png)


.webp)


.png)


.webp)

![7 Examples of Content for AEO and GEO [With Templates]](https://cdn.prod.website-files.com/632b673b055f4310bdb8637d/6a0c6a56eb700472e635ff33_1%20-%20How%20to%20Structure%20%20Content%20for%20AEO%20and%20GEO%20%20Summaries%20(2026).png)


.png)
.png)


.png)

.png)


%2520Agencies%2520(2025).png)

![Top 9 AI SEO Content Generators for 2026 [Ranked & Reviewed]](https://cdn.prod.website-files.com/632b673b055f4310bdb8637d/6858e2c2d1f91a0c0a48811a_ai%20seo%20content%20generator.webp)


.webp)
.webp)


.webp)